
Figure 2.
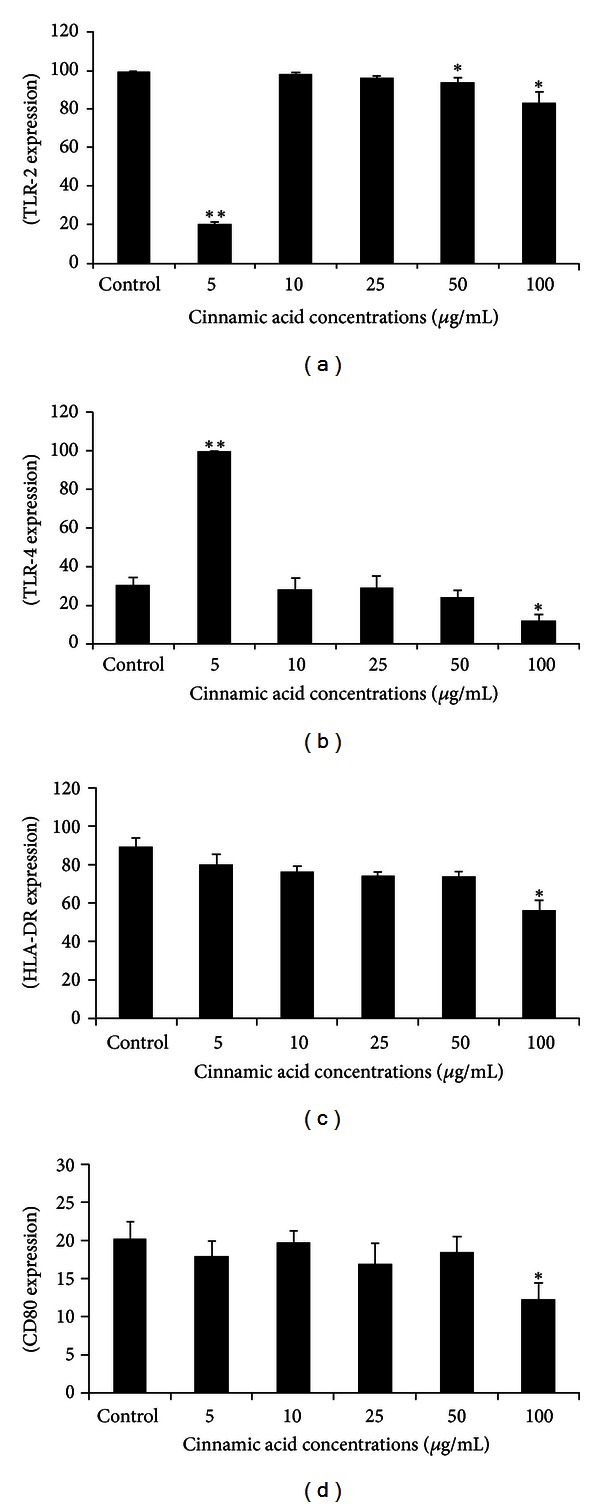
Mean fluorescence intensity (MIF) of TLR-2, TLR-4, HLA-DR, and CD80 expression by human monocytes incubated with cinnamic acid (5, 10, 25, 50, and 100 μg/mL) for 18 h. Data represent mean and standard deviation (n = 10). *Significantly different from control (P < 0.01), **significantly different from control (P < 0.001).