
Figure 4.
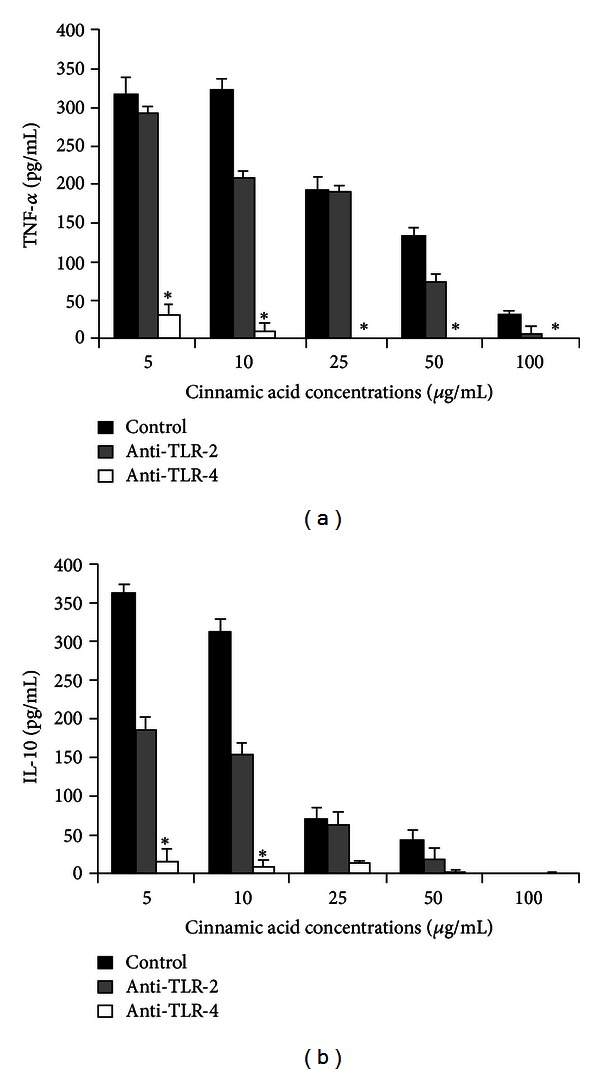
TNF-α and IL-10 production (pg/mL) by human monocytes treated or not with anti-TLR-2 or anti-TLR-4 and incubated with cinnamic acid (5, 10, 25, 50, and 100 μg/mL) for 18 h. Data represent mean and standard deviation (n = 10). *Significantly different from control of the respective concentration (P < 0.001).