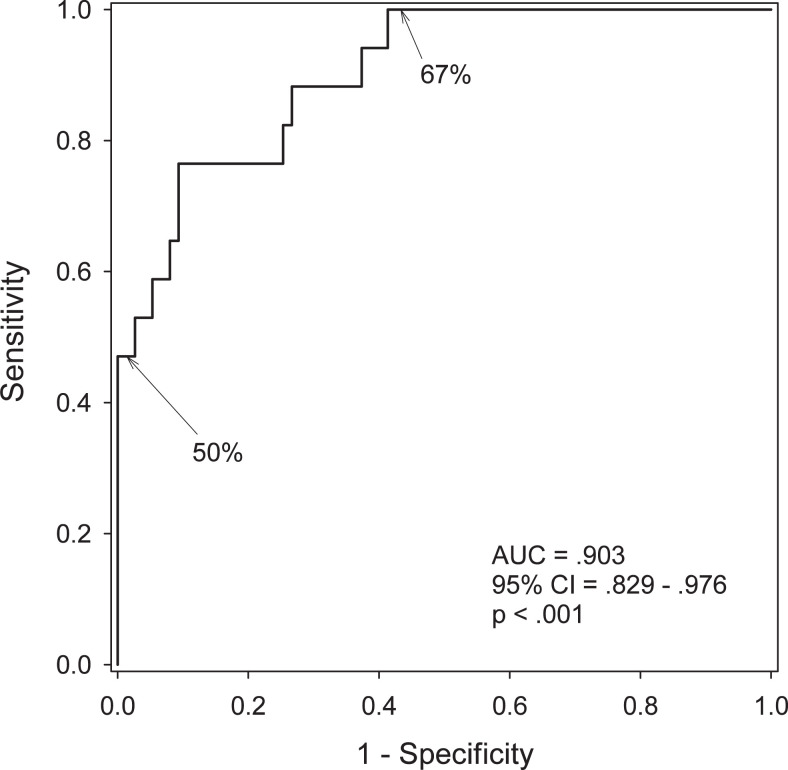
Figure 1.
Receiver–operating characteristic (ROC) curve for the VPC task shows that the task powerfully discriminates between participants who will convert and those who will not convert to aMCI/AD. The 2-minute delay scores from the VPC task for all participants (N = 92) were divided into 2 groups (converters = 17 and nonconverters = 75), with group designation based on diagnosis at time of writing (up to 3 years from testing). The 50% and 67% on the graph indicate the cut points in the score ranges. AD indicates Alzheimer’s disease; aMCI, amnestic mild cognitive impairment; VPC, Visual Paired Comparison.

