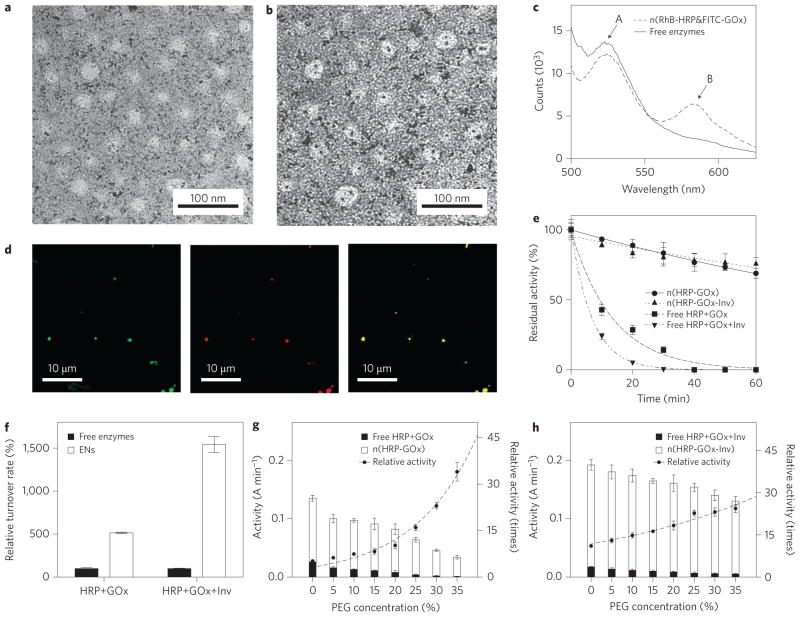
Figure 2. Structure and enhanced activity and stability of enzyme nanocomplexes.
a,b, Transmission electron micrograph showing the uniform size of n(HRP–GOx) and n(HRP–GOx) (a), prepared by labelling HRP and GOx with single gold nanoparticles (b). c, Fluorescence spectra of n(HRP–GOx) and a mixture of n(HRP) and n(GOx) with the same protein content. GOx and HRP were pre-labelled with FITC and RhB, respectively. The spectra were recorded with excitation at 450 nm. d, Confocal microscope images of n(FITC-labelled GOx) (left, excitation = 488 nm, emission = 510–530 nm), n(RhB-labelled HRP) (middle, excitation = 532 nm, emission = 570–600 nm) and n(RhB labelled HRP-FITC labelled GOx) (right, excitation = 488 nm; emission = 570–600 nm). e, Change in activity of n(HRP–GOx), n(HRP–GOx–Inv) and their native enzyme mixture counterparts during incubation at 65 °C. f, Turnover rates for n(HRP–GOx) and n(HRP–GOx–Inv) and their corresponding free enzyme mixtures. g, Activity of n(HRP–GOx) and a mixture containing the same amount of free HRP and GOx in the presence of increasing concentrations of PEG in phosphate buffer (50 mM, pH 7.0). h, Activity of n(HRP–GOx–Inv) and a mixture containing the same amount of free HRP, GOx and Inv as the complex in the presence of increasing PEG concentrations. Relative activities were normalized by the activities of the free enzyme mixtures with the same enzyme content and PEG concentration. The activity unit (A min−1) represents the absorbance change (at 460 nm) of the reaction solution per minute. Data represent mean±standard error of the mean (s.e.m.) from three independent experiments.

