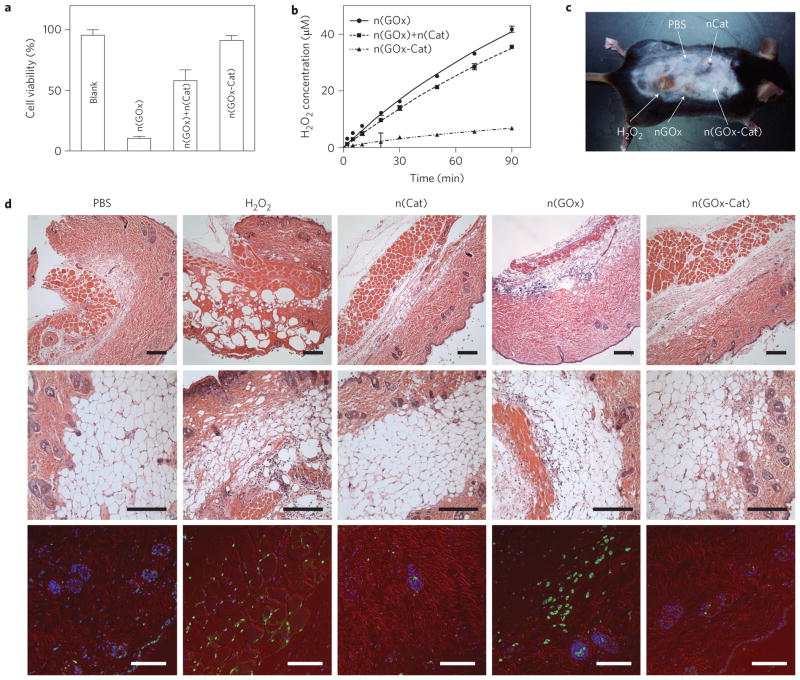
Figure 3. In vivo detoxifying capability of the catalase-containing enzyme nanocomplexes.
a, Cell viability assays after treated with n(GOx), mixture of n(GOx) and n(Cat), and n(GOx-Cat). Cell proliferation rates were normalized with those of the untreated cells. Cell viability assays were performed by incubating the treated cells with CellTiter Blue for 3 h at 37 °C. b, H2O2 concentration in glucose oxidation reaction catalysed by n(GOx), n(GOx)+n(Cat) or n(GOx-Cat). Enzyme reactions were performed in 1× phosphate buffer saline (PBS) and the initial concentration of glucose is 2 mg mL−1. The system with n(GOx), the mixture of n(GOx) and n(Cat), and n(GOx–Cat) show rates of 0.434±0.004 μMmin−1, 0.388± 0.005 μMmin−1, and 0.075± 0.007 μMmin−1, respectively. c, Photograph of a mouse cutaneously injected with PBS, n(Cat), H2O2, n(GOx) and n(GOx–Cat) at different sites. d, Micrographs of mouse skin tissue at the injection sites. Skin tissue was collected from the animal shown in c. Top and middle: H&E stained images. Bottom: Immunohistology stain with TUNEL assay (green), Cy3-conjugated monoclonal α-smooth muscle actin antibody (red) and DAPI (blue). Scale bars, 100 μm. Data represent mean±s.e.m. from three independent experiments.

