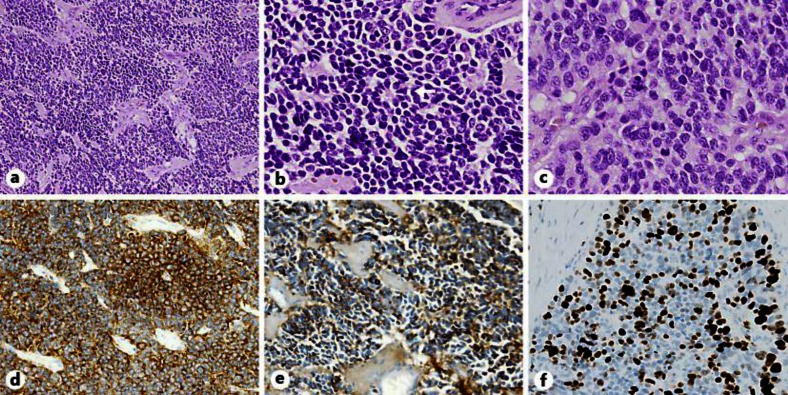
Fig. 3.
NEC in the resected pancreatic tumor. a Carcinomatous growth patterns of neuroendocrine cells can be seen with HE staining. ×100. b, c High-power view of the tumor demonstrates a rosette pattern (arrow), ×200 (b) and solid pattern, ×400 (c). d Synaptophysin staining of the solid area demonstrates endocrine carcinoma. ×200. e Chromogranin A shows a similar pattern with less intense staining. ×200. MIB-1 proliferative index was greater than 30%.

