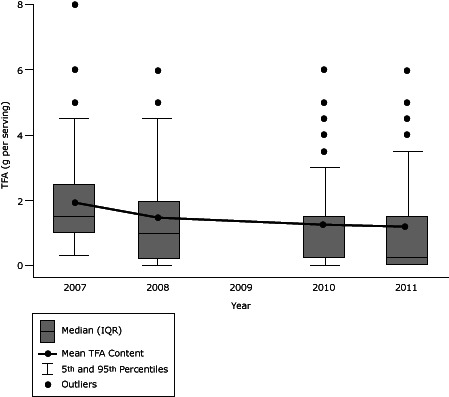
Figure 1.

Trans-fatty acid (TFA) content from 2007 through 2011 of 270 brand-name US supermarket food products that contained TFA in 2007 and were still marketed in 2011. In 2010, the 25th percentile and median values were identical (0.25 g/serving). All P values < .01 comparing mean TFA content of all products in each year to mean TFA content in the following year of data collection. Products listing 0g TFA but still containing partially hydrogenated vegetable oils in the ingredients list were considered to contain 0.25 g/serving of TFA and were not included as eliminating industrial TFA. Data were not collected in 2009. Abbreviations: SE, standard error; IQR, interquartile range.
| Characteristic | Year | |||
|---|---|---|---|---|
| 2007 | 2008 | 2010 | 2011 | |
| Number of products containing any TFA (%) | 270 (100) | 231 (86) | 203 (75) | 197 (72) |
| Mean (SE) TFA content, g/serving | 1.9 (0.1) | 1.3 (0.1) | 1.0 (0.1) | 0.9 (0.1) |
| Median (IQR) TFA content, g/serving | 1.5 (1.0–2.5) | 1.0 (0.25–2.0) | 0.3 (0.3–1.5) | 0.3 (0-1.5) |
