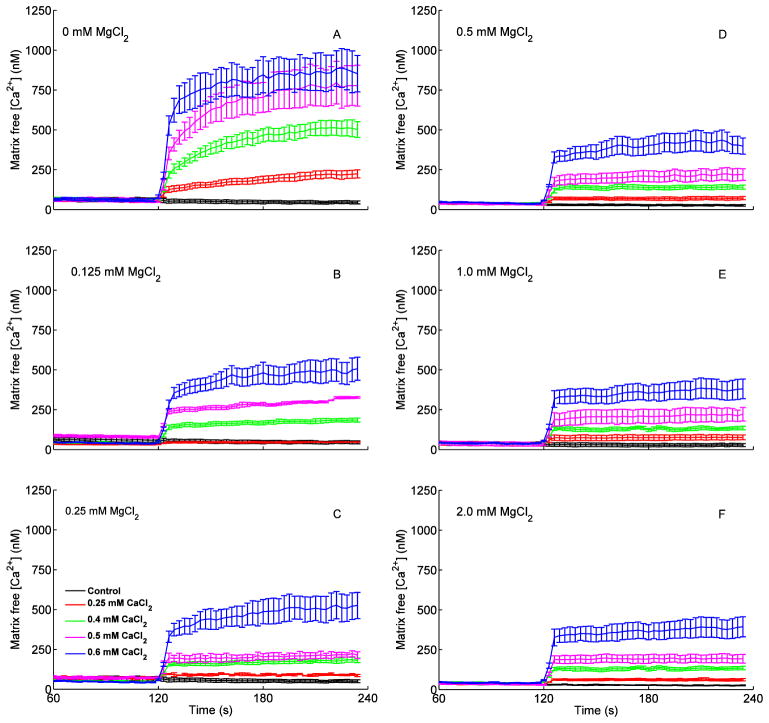
Fig. 4.
Changes in dynamics of [Ca2+]m after adding PA, CaCl2 and ADP as shown in Fig. 1 timeline. Each left panel (A–F) shows five traces corresponding to added CaCl2 in the presence of 0 mM (no added) MgCl2 (A) and added MgCl2 (B, 0.125; C, 0.25; D, 0.5; E, 1; F, 2 mM). There appeared to be two phases of Ca2+ uptake via the CU at these levels of MgCl2: a rapid uptake phase (5–10 s) and a slow uptake phase (1–2 min). See Fig 5 for statistics.

