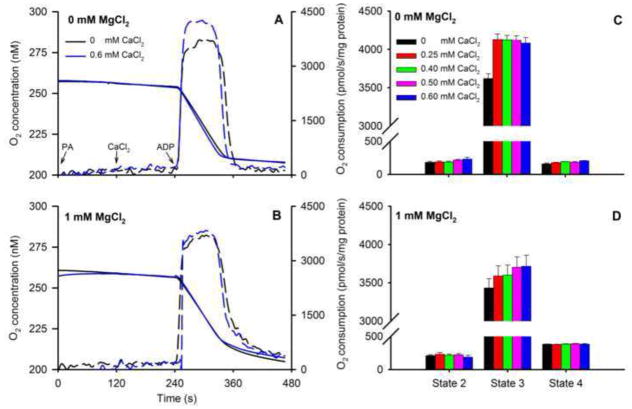
Fig. 7.
Representative traces of O2 concentration for 0 (solid black line) and 0.60 mM (solid blue line) CaCl2 without added MgCl2 (A) or with 1 mM MgCl2 (B) in response to adding PA, CaCl2, and ADP as shown in the timeline scheme (Fig. 1). Dotted lines are the first derivatives showing the maximal rates of change during state 3. Calculated mean O2 consumption rates (C,D) increased in the presence 0.25 mM CaCl2 during state 3 respiration; higher [CaCl2] did not increase state 3 respiration further. Adding MgCl2 attenuated state 3 respiration. Adding MgCl2 enhanced state 4 respiration at all [CaCl2], which was compatible with the decreased NADH during state 4 respiration (Fig. 6). See Fig. 9 for statistics.

