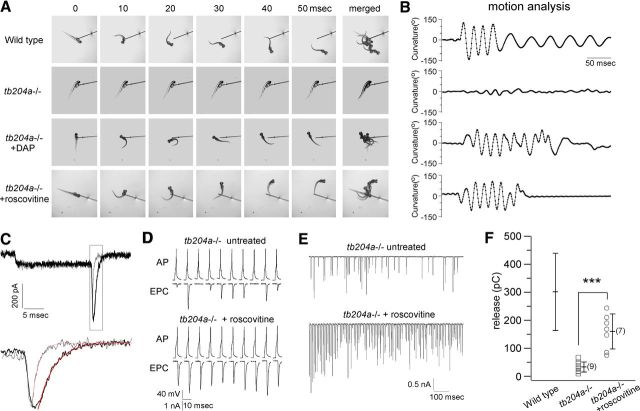
Figure 6.
Roscovitine rescues tb204a mutant phenotype. A, Comparison of the touch responses from wild-type, tb204a mutant, and tb204a mutant following treatment with either 200 μm DAP or 100 μm roscovitine. Six consecutive still images taken at 10 ms intervals following mechanical stimulation are shown. Merged images are shown at the end of each row. B, Motion analysis of mechanically induced escape responses using Flote software. The curvature reflects the degree of body axis bend associated with the swimming. C, Barium currents recorded from zebrafish P/Q-type calcium channels expressed in HEK cells before (gray) and 30 s into (black) application of roscovitine. The voltage was stepped from −80 mV to +40 mV for 20 ms before returning to −80 mV. Tail currents shown in the box are expanded in the lower traces and the fits to a single exponential curve shown in red. D, Paired recording traces from untreated and roscovitine treated tb204a mutant fish are shown for 1 Hz stimulation. E, Paired recording traces from an untreated tb204a mutant and a roscovitine treated mutant fish during 1 s, 100 Hz stimulation. F, Comparison of total release during 1 s, 100 Hz stimulation from untreated and roscovitine treated tb204a mutant fish. Each symbol corresponds to the value obtained for individual experiments. The overall mean, SD and n value (in parentheses) for each condition are shown. The mean ± SD previously shown in Figures 1 and 3 for wild-type fish are indicated for the purpose of comparison. ***p < 0.001.

