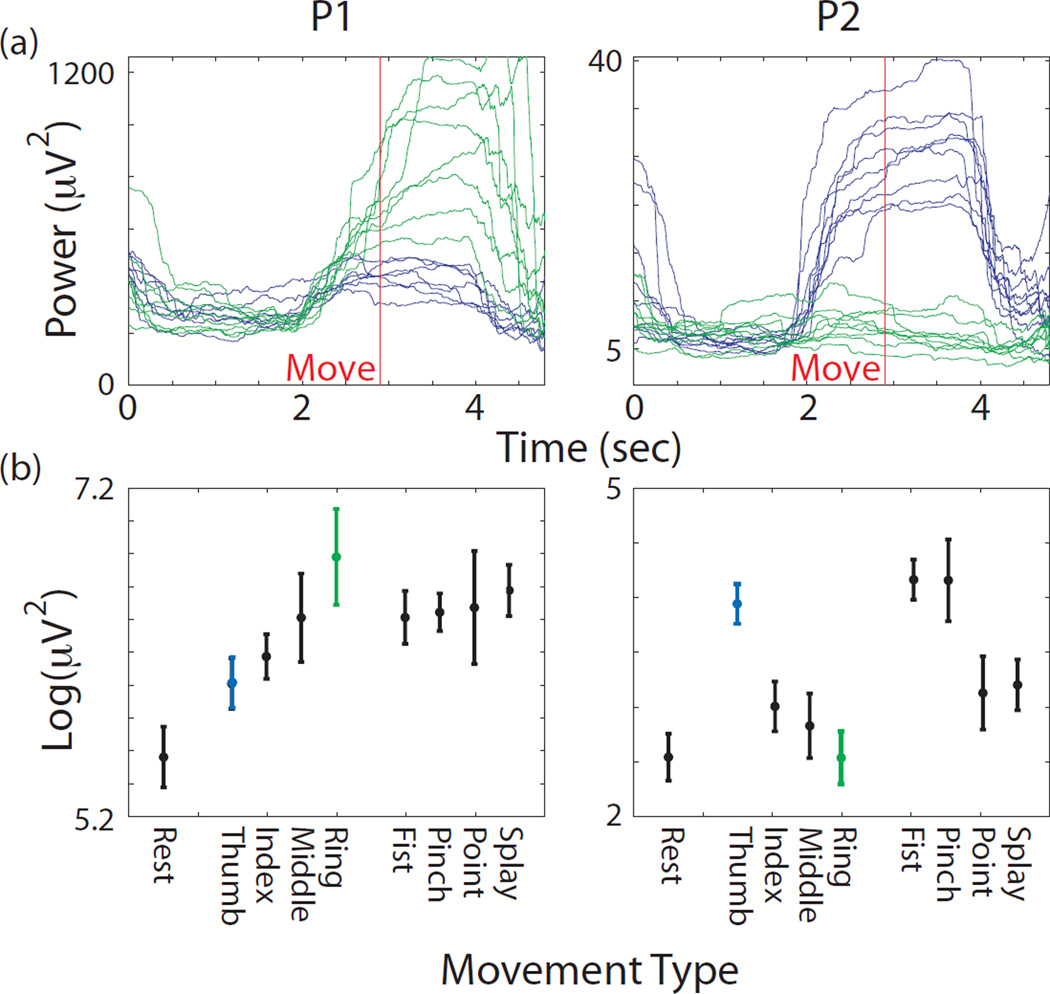
Figure 2.
(a) Log power calculated from filtered voltage data in the high gamma band (66–114 Hz). Data shown from best single electrode (outside of primary sensory cortex) for differentiating thumb and ring finger movements. Single trial traces shown from the middle portions of the trials aligned to move-onset. Blue shows data from isometric thumb pressing trials, while green shows data from ring finger trials. Left panel shows data from participant P1 and right panel shows data from participant P2. Data were smoothed with a 2 second sliding window to reveal the trend (b) Average log power in the gamma band from these same electrodes during the 8 instructed movement types and rest, as labeled on the x-axis. Power was averaged across a 2 sec window starting 0.5 sec before movement onset, which was determined from glove sensor data. Error bars denote standard deviation.

