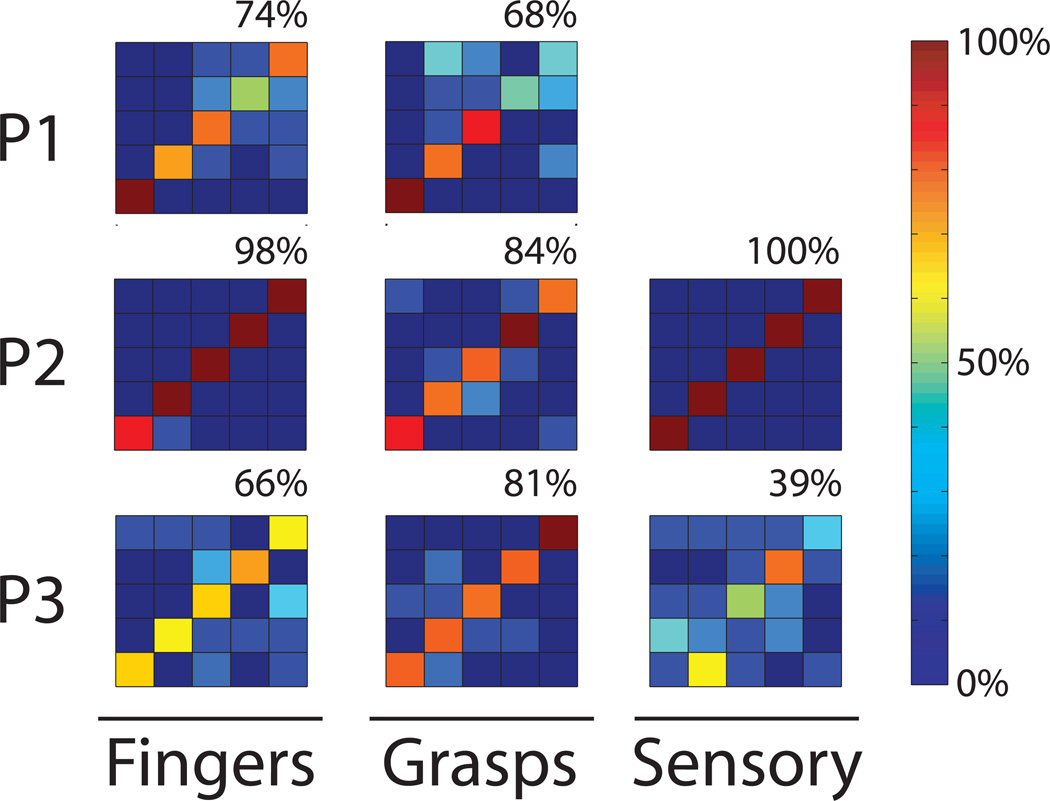
Figure 3.
Confusion matrices showing the percent correct when classifying each of four finger movements (thumb, index, middle, ring) and rest in the left most column, or each of five hand postures (rest, fist, pinch, point, and finger-splay) in the middle column. Each row corresponds to one participant. Percentage classified as a given hand posture is shown in the color bar. Perfect performance is a dark red diagonal line, and the overall percentage of correct answers is shown in the upper right. Rightmost column shows passive sensory finger touches in P2 and P3.

