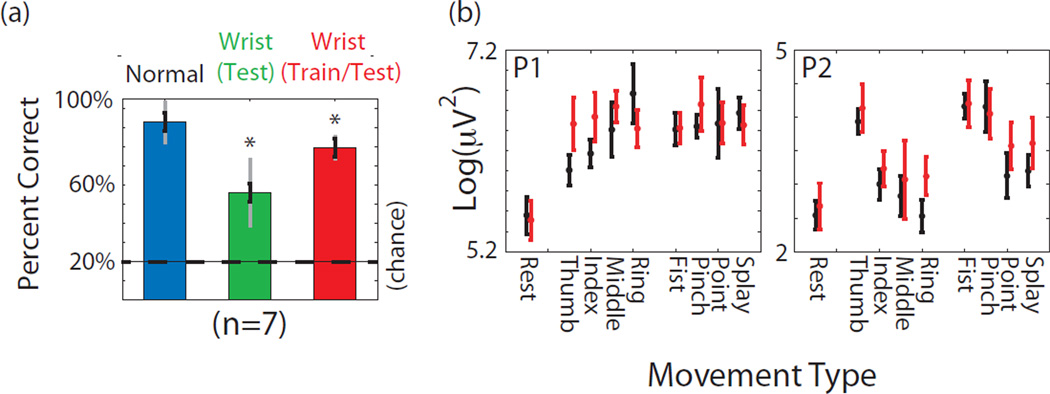
Figure 7.
(a) Percent correct classifying 1 of 4 hand postures and rest (chance 25%) in all 3 participants. To combine data across participants, performance values were normalized to the average performance value from a given participant. Blue corresponds to baseline data during isolated isometric hand postures. Green shows percent correct when a model generating during normal isometric hand postures is used while the wrist is simultaneously exing and extending simultaneously with grasps. Red column shows percent correct when the decoder was trained (and tested) on hand postures that included wrist movements. All data is cross validated on a per trial basis. Asterisks denote a significant decline from baseline in blue (p<0.01) based on a one way ANOVA, and black error bars denote the standard error. Gray bars denote standard deviation. (b) Average log gamma power as described in Figure 2 from the same two behaviorally-tuned electrodes. Black bars denote power during normal isometric movements. Red bars denote power during same movements while the wrist was simultaneously exing or extending.

