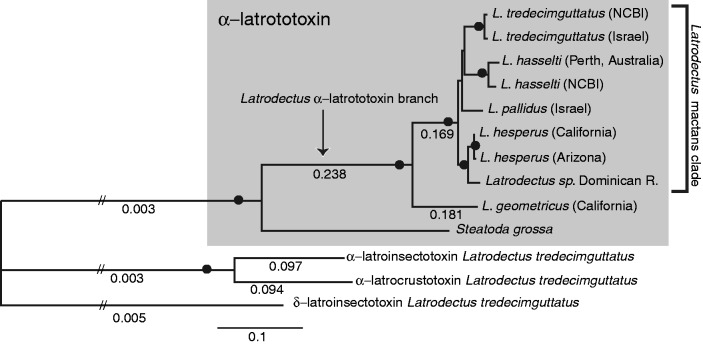
Fig. 2.
Phylogram based on ML analysis of 4.2 kb α-latrotoxin alignment, with black dots indicating nodes with 100% bootstrap support in ML and parsimony analyses and with posterior probability values of 1.0 in partitioned Bayesian analyses. Numbers under branches are ω values estimated with codeml using the free ratio model; all other ω values not shown range from 0.000 to 0.556. Hatched lines indicate shortened branches for figure quality. The tree was rooted with the α-latrotoxin latrotoxin paralog δ-latroinsectotoxin.

