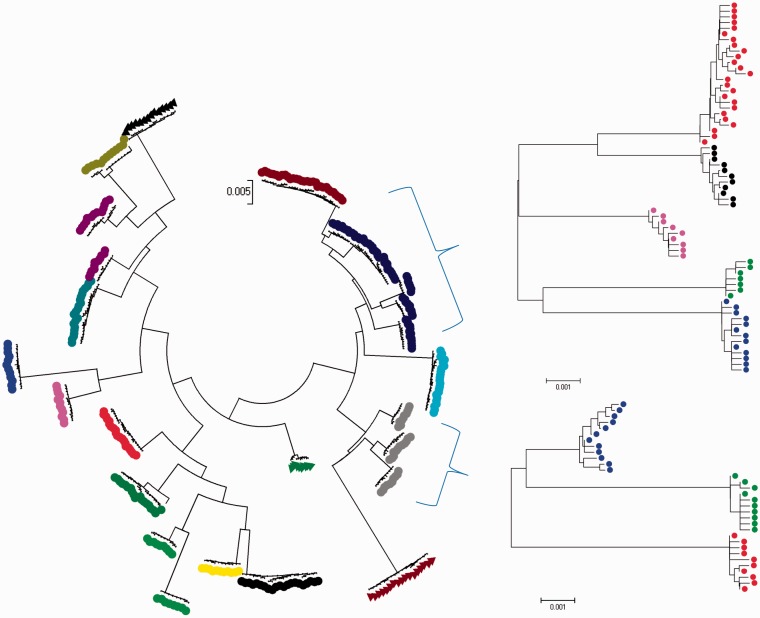
Fig. 3.
Results from a hierarchical BAPS clustering of 25,000 strains of simulated bacteria from a population subdivided into 25 patches of 1,000 strains each with no between-patch migration and no patch turnover. The mutation rate of 0.0001 per locus/individual/generation was used in the simulation such that the population is subject to local recombination at a per locus rate 10 times more frequent than mutation. The tree on the left is the result from the first level of BAPS clustering, with leaf colors indicating their assignment into detected clusters. The trees on the right show cluster assignments from the second level of BAPS clustering, where two “conservative” clusters are correctly split with respect to the underlying patches used in the simulation process.

