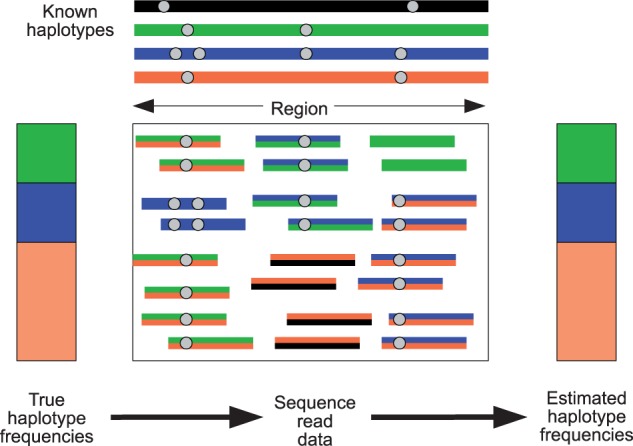
Fig. 1.

Haplotype information from individual reads can be combined across a genomic region to obtain haplotype frequency estimates. In this cartoon, there are four known haplotypes (black, green, blue, and orange), with sequence data coming from a pool containing 25% green, 25% blue, and 50% orange haplotypes. Each read is probabilistically assigned to the known haplotypes. Some reads can be assigned with great certainty, for example, the reads coming from the blue haplotype that cover two neighboring variant sites. Other reads (represented by two colors) are assigned with less certainty.
