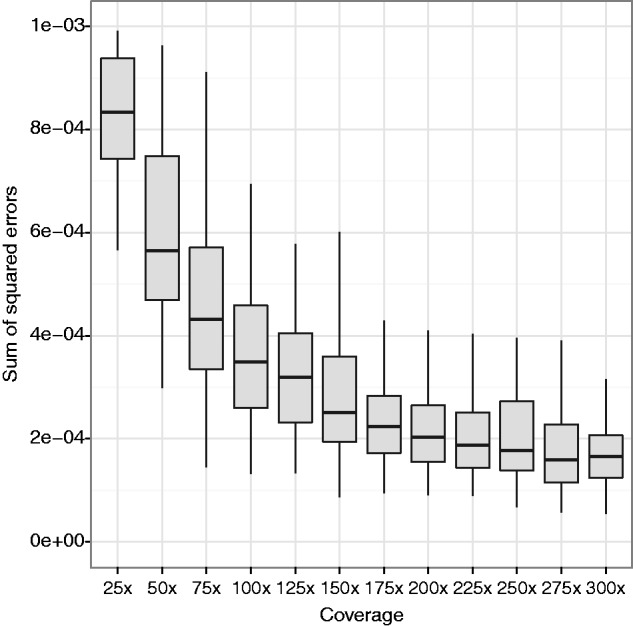
Fig. 6.

Performance of the EM algorithm on the calculation of species-level abundances from 16S rRNA sequence data. The algorithm was run on simulated 75-bp single-end 16S sequence data from pools of 200 randomly chosen microbial species, with 100 replicates for each coverage level.
