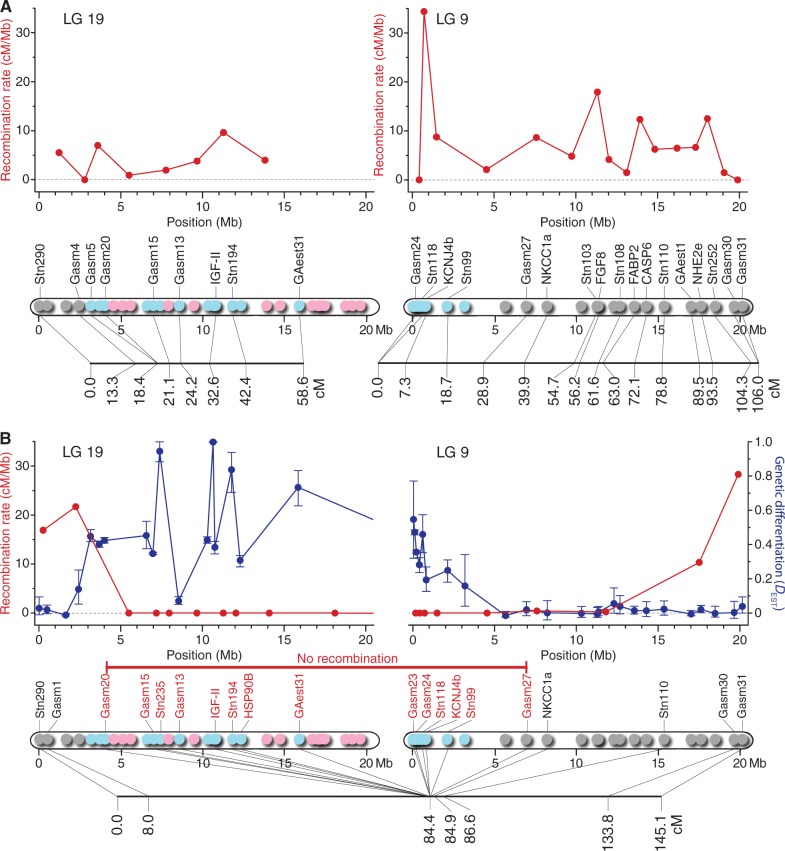
Fig. 7.
Recombination rates (red) and genetic linkage maps for LGs 19 and 9 in female meiosis (A) and male meiosis (B) in J-BIW. DEST values and 95% confidence intervals (blue) are shown in (B). Recombination rates are plotted against intermediate physical location between adjacent loci. The numbers in the linkage maps represent genetic map distances in Kosambi centimorgan (cM). The colors in the physical maps indicate allelic patterns at 55 loci on LGs 19 and 9 in J-BIW (see fig. 4 for details).

