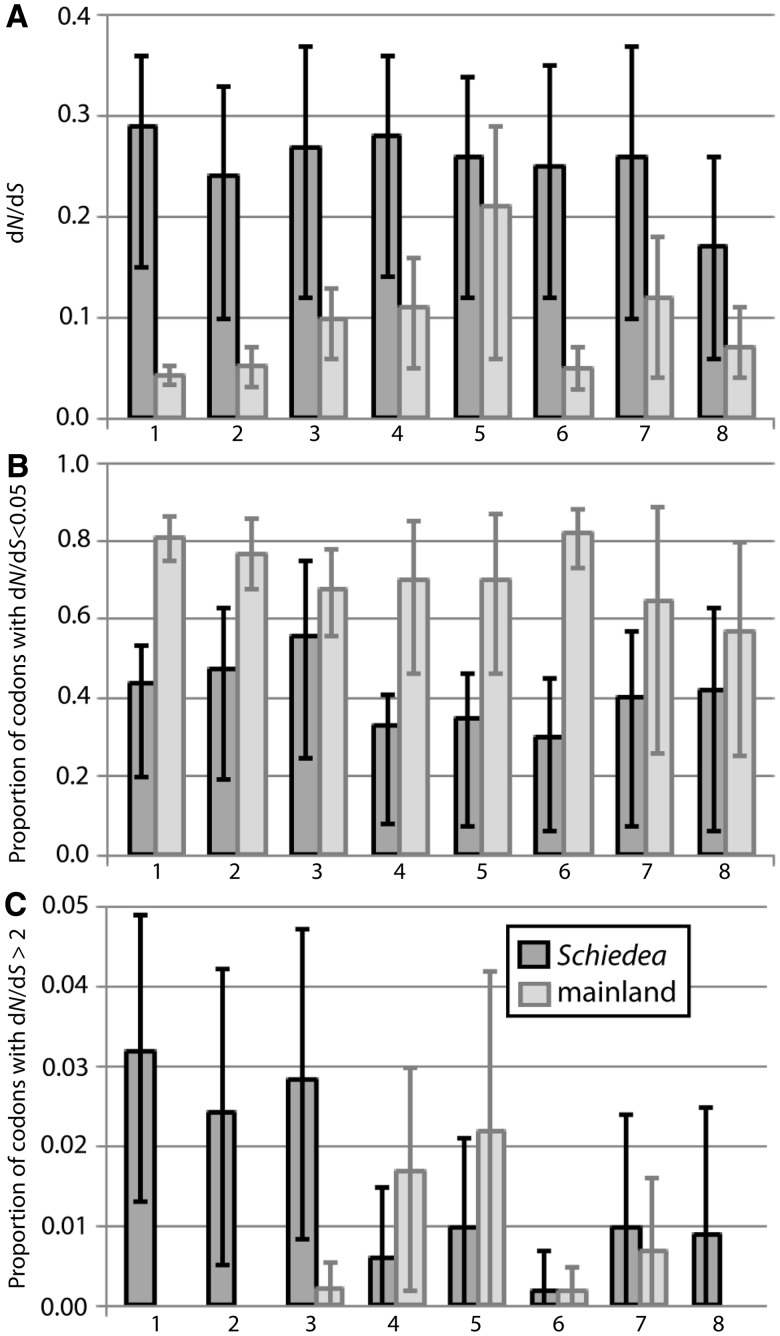
Fig. 2.
The three leftmost pairs of columns represent comparisons between the data set of 27 Hawaiian Schiedea species (dark gray bars) and three mainland plant groups represented by over 20 species each (Poaceae, Asteraceae, and Fabaceae; light gray); the following five pairs of columns represent comparisons between the subset of seven Schiedea species (dark gray bars) and five mainland plant groups represented by 6–8 species each (Helianthus, Populus, Cichorieae, Citrus, and Solanum; light gray). (A) dN/dS estimated assuming a single ratio for all codons and branches of a tree (M0 model) and averaged over all studied genes; (B) proportions of codons under strong purifying selection (with dN/dS < 0.05), calculated using model M8 implemented in PAML; (C) proportions of codons under strong positive selection (with dN/dS > 2), calculated as in (B). Each of eight pairs of columns represents data averaged across 20, 14, 13, 19, 15, 14, 12, and 10 genes, respectively. Differences between Schiedea and three family-level mainland groups (Poaceae, Asteraceae, and Fabaceae) were significant (P < 0.05; the Kruskal–Wallis test), with the exception of the comparison of purifying selection between Schiedea and Fabaceae (B-3). Differences between Schiedea and the genus-level mainland groups (Helianthus, Populus, Cichorieae, Citrus, and Solanum) were not significant (P > 0.05; the Kruskal–Wallis test), with the exception of the comparisons for average dN/dS and purifying selection between Schiedea and Cichorieae (A-6 and B-6). All presented data are back-transformed from log transformation performed to calculate 95% confidence interval shown by error bars. Original values are presented in the supplementary table S6, Supplementary Material online.

