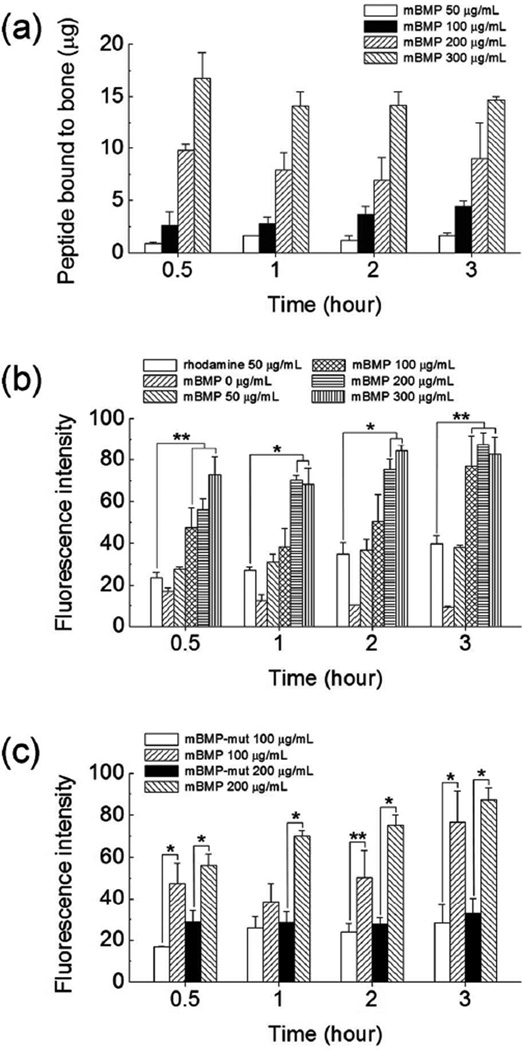
Figure 2.
(a) Amount of rhodamine-labeled mBMP bond to cortical bone after incubating in various conditions. Quantification of fluorescence intensity of (b) rhodamine-labeled mBMP bound to cortical bone by incubating in various conditions, and (c) rhodamine-labeled mBMP and mBMP-mut bound to cortical bone by incubating in 100 µg/mL peptide solution for different time periods. Data are shown as mean ± standard deviation. * p < 0.01 and ** p < 0.05.

