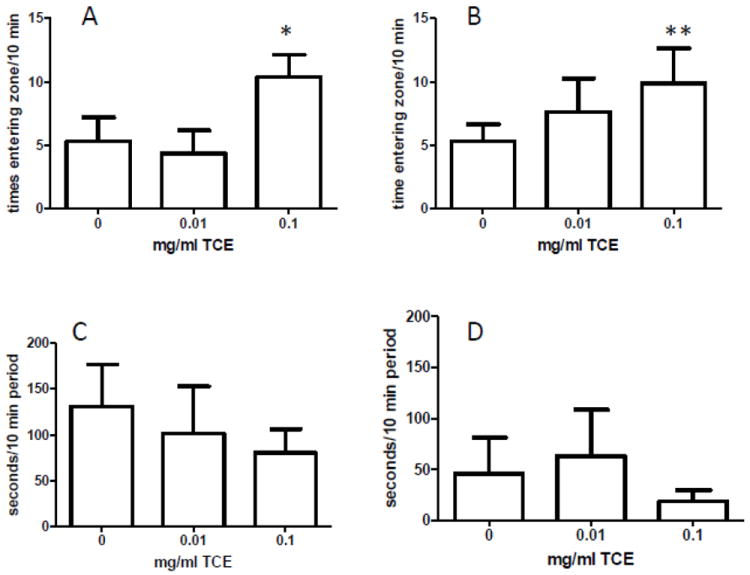
Fig. 7.

TCE exposure increased exploratory behavior. Methodological and statistical methods are described in the Methods section. The number of times entering the zone with the novel object (A) or novel mouse (B) were counted in a 10 min period using EthoVision behavioral tracking software. The latency to approach the zone with the novel object (C) or mouse (D) was measured in seconds within a 10 min period using EthoVision. Graphs represent the mean ± SEM. * (A) statistically significant comparing 0.1 mg/ml TCE vs. controls (p=0.006) and 0.01 mg/ml TCE (0.008). **(B) statistically significant comparing 0.1 mg/ml TCE vs. controls (p<0.001).
