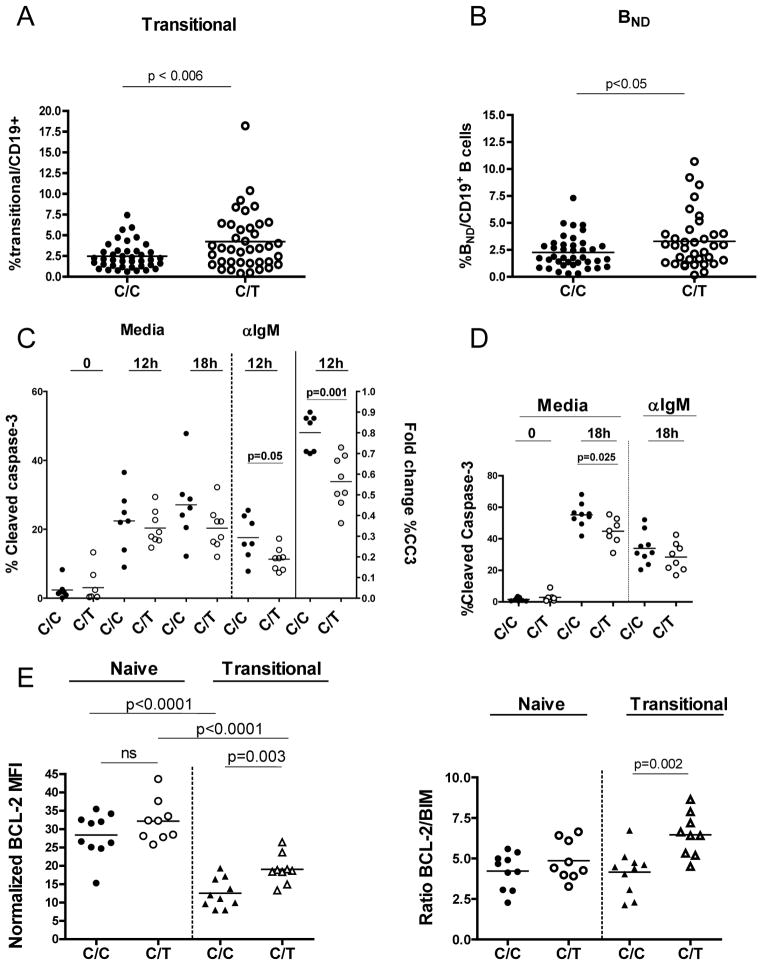
Figure 1. Altered B cell homeostasis in healthy PTPN22 1858C/T subjects is associated with reduced apoptosis of naïve and transitional B cells.
Previously frozen PBMC from age-matched control 1858C/C and C/T subjects (ages 19–46 years) were stained with antibodies to CD19, CD27, CD10, CD24, CD38, IgM and IgD and analyzed by FACS for the relative frequencies of transitional, naïve, memory and anergic B ND B cells. (A) Transitional B cells (CD19+CD27negCD10+CD24hiCD38hi) are increased in individuals who carry the PTPN22T risk allele (p<0.006; n=40 1858C/C subjects, n=39 1858C/T subjects). (B) Increased frequency of BND B cells (CD19+CD27negIgD+IgMneg) in PTPN22 1858T individuals (p<0.05; n=40 1858C/C subjects, mean 2.26% ±0.24 SEM; n=36 1858C/T subjects, mean 3.3% ±0.42 SEM). BND B cells are also CD10loCD24loCD38int. Bars represent the mean frequency relative to total CD19+ B cells and each symbol represents an individual. (C) Naïve B cells from healthy 1858C/C (n=7) and C/T (n=8) subjects were sorted from fresh PBMC and cultured in the presence or absence of anti-IgM F(ab′)2 for 0, 12, and 18 h. The percentage of active caspase -3+ cells (left axis) is indicated for each condition (media vs. anti-IgM). Right axis values depict fold change in the percentage of caspase3+ naïve B cells (anti-IgM-treated/media) after 12 h. (D) Transitional B cells from healthy 1858C/C (n=9) and C/T (n=7, media; n=8, anti -IgM-treated) were sorted from fresh PBMC and cultured as in (B) for 0 and 18 h and apoptosis measured as in (B). (E) Previously frozen PBMCs were stained with anti-CD20, CD27, -CD38, and –CD24 mAbs to identify transitional, naïve, and memory B cell subsets. Fixed and permeabilized cells were stained with anti-BCL-2, anti-Bim, or the corresponding isotype control antibodies and analyzed by flow cytometry. Left panel, BCL-2 expression in gated naïve and transitional B cells (n=10 C/C, n=9 C/T); Right panel, ratio BCL-2/Bim expression for subjects depicted in top panel. Each symbol represents a unique individual and bars represent the mean.

