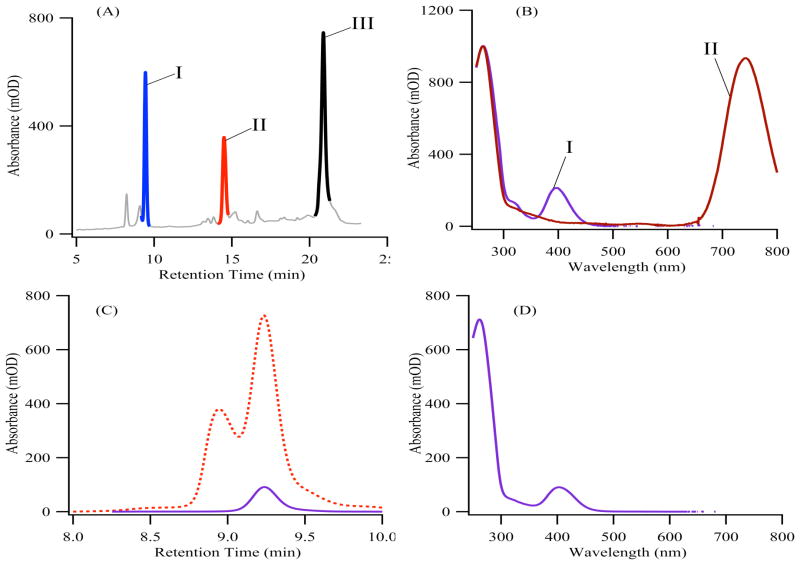
Figure 2.
(Adapted from Ref. 33) Chromatographic purification of silver cluster-DNA conjugates. (A) The reversed-phase chromatogram at 260nm absorbance shows all species containing the C3AC3AC3TC3A ss-DNA scaffold. (B) The absorption spectra corresponding to peaks I and II from (A) show the distinct spectra associated with each resolved cluster.36 (C) A size exclusion chromatogram for a violet-absorbing cluster bound to a DNA strand was acquired at 260 nm (red dotted line) and at 400 nm (solid violet line). Correspondence between the DNA- and cluster-specific chromatograms identifies the conjugate, whose spectrum is provided in (D).33

