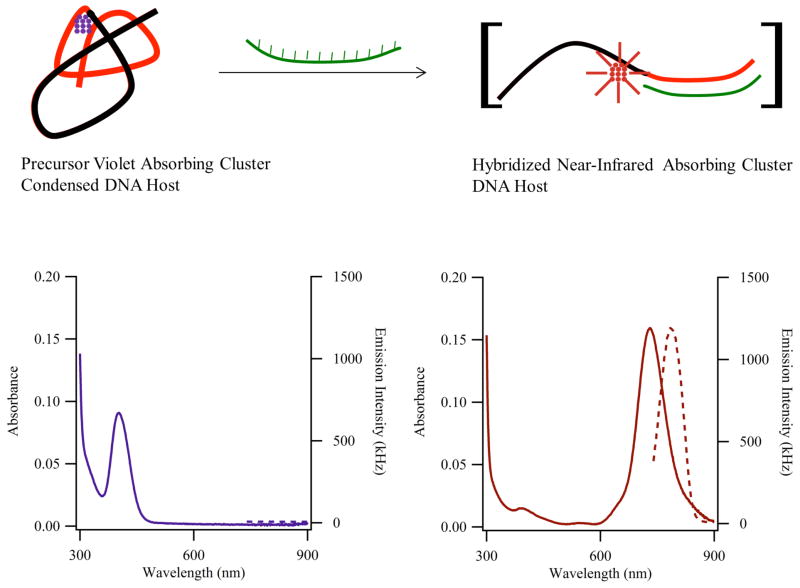
Figure 5.
(Adapted from Ref. 33) The reaction summarizes how the structure of the sensor strand and the stoichiometry of the cluster are linked with the changes in the absorption (solid lines – left axes) and emission (dotted lines – right axes) spectra in the lower panels. (Left) The sensor is comprised of a cluster template (black portion) and a recognition site (red portion) and is folded by an ~11 silver atom cluster (violet) with τmax = 400 nm and minimal near-infrared emission. (Right) Addition of the complementary strand (green) opens the sensor strand, and the absorption of the resulting ~11 atom cluster red-shifts to 730 nm, and the associated emission is magnified.

