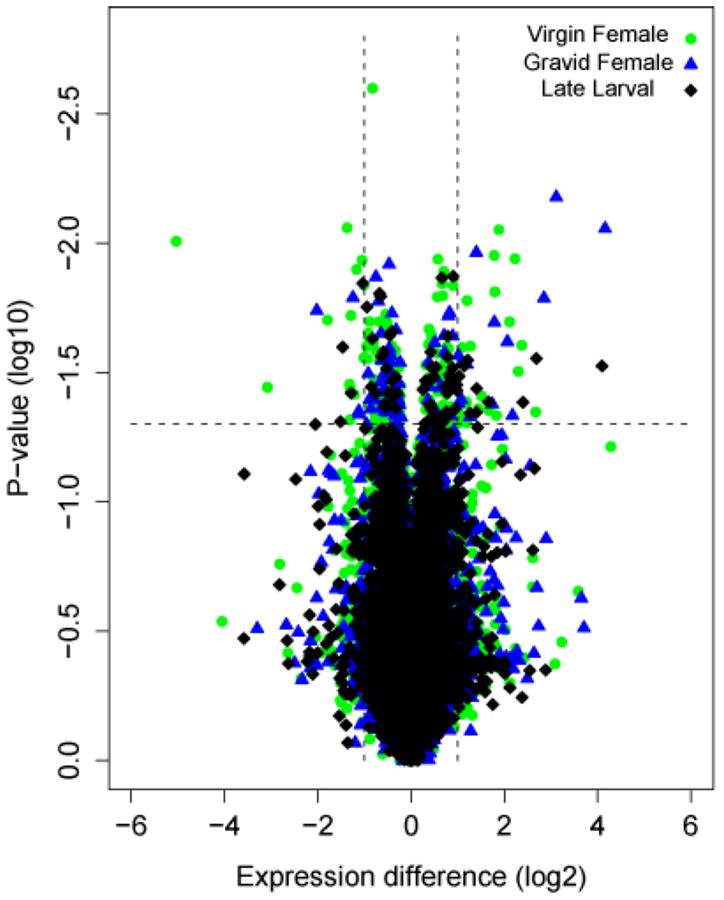
Figure 1.

Volcano plot of significance against relative expression differences from microarray comparisons between A. gambiae M and S molecular forms at three developmental periods. Each symbol represents one gene that had detectable expression in either form in late larvae (black diamond), virgin females (green dot), or gravid females (blue triangle). The x-axis displays log2-transformed signal intensity differences between M and S; positive values represent overexpression in S while negative values represent overexpression in M. The Y-axis displays log10-transformed P-values associated with ANOVA tests of differential gene expression. The horizontal dashed line indicates the threshold for significance; the vertical dashed lines indicate thresholds for differential gene expression in excess of twofold.
