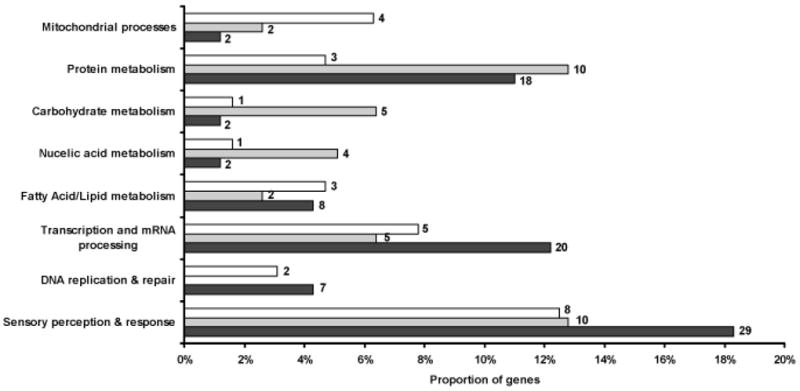
Figure 3.

Distribution of differentially expressed genes among functional categories at each developmental period. Bars indicate the proportion of genes in each category: black, virgin females; gray, gravid females; white, late larvae. Number of genes in each category is given beside each bar. Percentages do not total to 100 as not all categories are shown.
