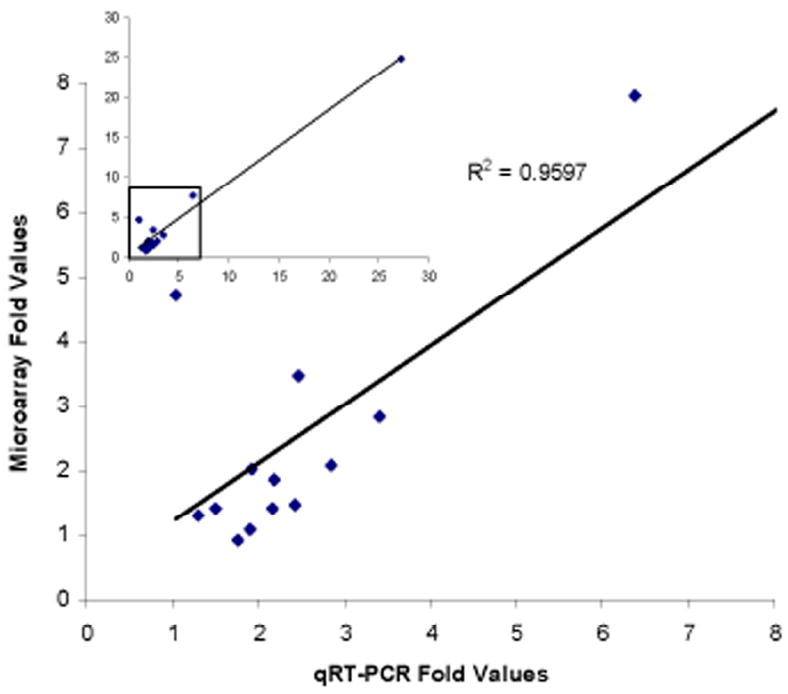
Figure 4.

Correlation between microarray and qRT-PCR estimates of gene expression differences between A. gambiae M and S virgin females. Inset at upper left shows the plot for all 14 genes; the box enclosing data from 13 of the genes is magnified in the plot below.
