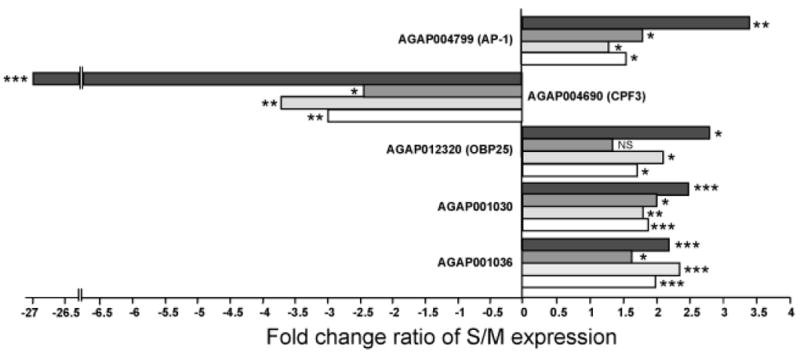
Figure 5.

Differential gene expression assessed for five genes by qRT-PCR in A. gambiae M and S samples from laboratory colonies and natural populations. Horizontal bars represent average fold change ratio between S and M samples from laboratory colonies (black bars) or field-collected samples from Burkina Faso (dark gray bars), Cameroon (light gray bars), and Burkina Faso + Cameroon (white bars). Positive values represent overexpression in S; negative values represent overexpression in M. P-values are indicated as NS, not significant; *, P<0.05; **, P<0.01; ***, P<0.001.
