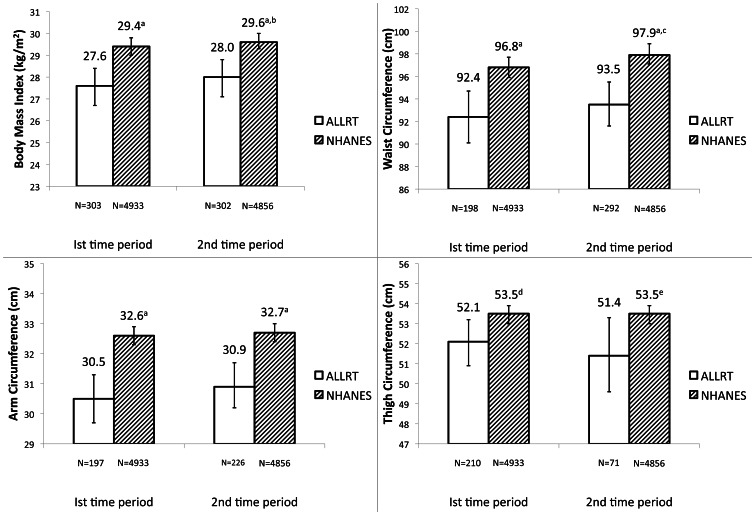
Figure 3. Mean (95% CI) anthropometrics among females, adjusted* for age, race, √height, smoking history and diabetes history.
NHANES: National Health and Nutrition Examination Survey ALLRT: AIDS Clinical Trials Group Longitudinal Linked Randomized Trials *Age centered at 40 years; reference for race is white; reference for smoking history is non-smoker; reference for diabetes history is no diabetes history. BMI not adjusted for √height. a NHANES significantly different from ALLRT (p<0.0001). b Significantly different from 1st time period (p = 0.02). c Significantly different from 1st time period (p<0.0001). d NHANES significantly different from ALLRT (p = 0.01). e NHANES significantly different from ALLRT (p = 0.03).

