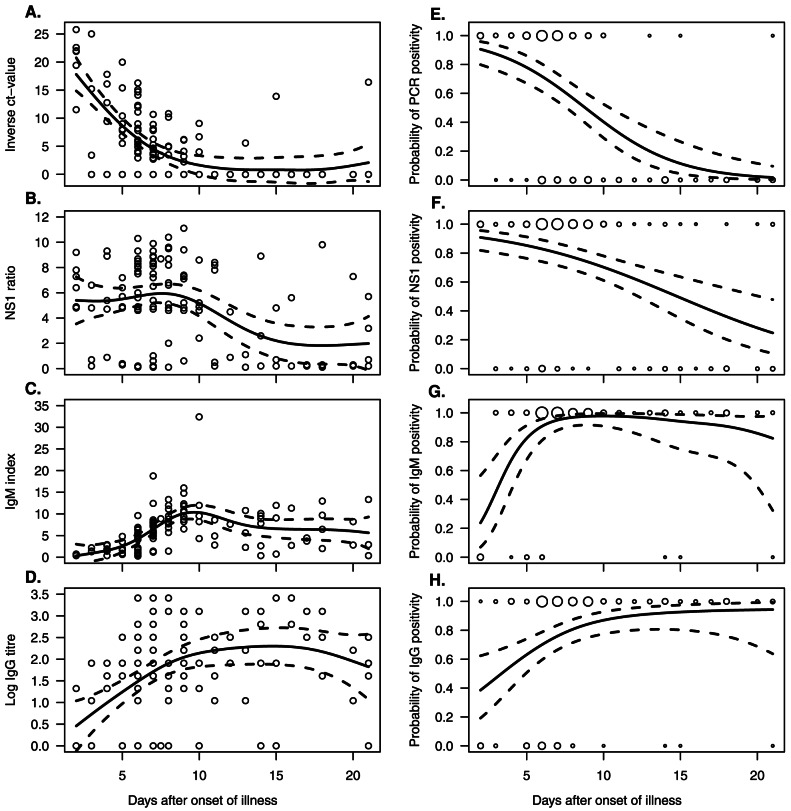
Figure 1. Kinetics of diagnostic markers.
Relative amounts (A–D) and the probability of a positive result (E–H) of DENV-RNA, NS1 protein, and DENV specific IgM and IgG antibodies in the serum samples of 93 patients with acute dengue fever. Solid lines indicate predicted means (A–D), and probabilities (E–H) from generalized additive mixed models (GAMM), and dashed lines their 95% confidence intervals. In A–D, the circles serve to illustrate individual observations; in E–H, the circles show the positive/negative test results at each given time point, the size of the circle being proportional to the number of observations.

