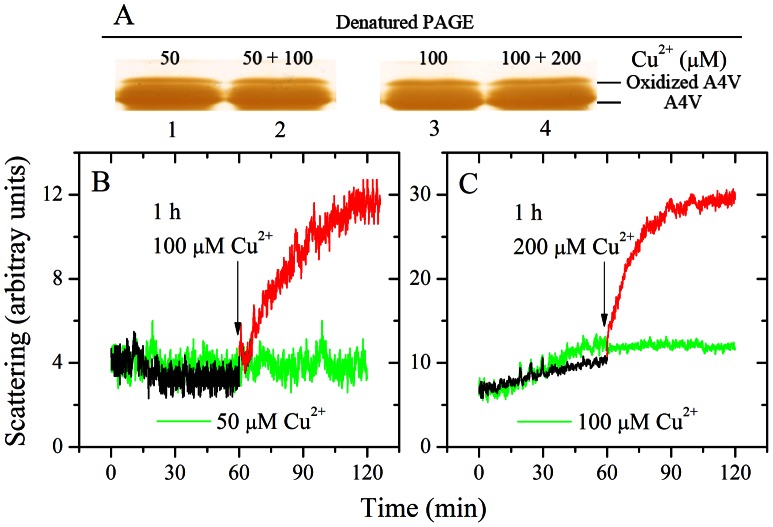
Figure 6. Effect of Cu2+ on A4V aggregation at various time points.
13.5% SDS-PAGE of 10 µM A4V incubated with 50 µM Cu2+ in 20 mM Tris-HCl buffer (pH 7.4) for 1 h (lane 1) and then incubated with 150 µM Cu2+ for 1 h (lane 2), and that of 10 µM A4V incubated with 100 µM Cu2+ for 1 h (lane 3) and then incubated with 300 µM Cu2+ for 1 h (lane 4) (A). Gels were stained with silver. 10 µM A4V was incubated 50 µM Cu2+ in 20 mM Tris-HCl buffer (pH 7.4) (black curves) and then added another 100 µM Cu2+ (red curves) (B). 10 µM A4V was incubated 100 µM Cu2+ in 20 mM Tris-HCl buffer (pH 7.4) (black curves) and then added another 200 µM Cu2+ (red curves) (C). The time of addition is marked by black arrows and the curves are compared with 10 µM A4V incubated with 50 µM Cu2+ (green curves) (B) and 10 µM A4V incubated with 100 µM Cu2+ (green curves) (C), respectively. Aggregation was measured by 90o light scattering at 37°C.

