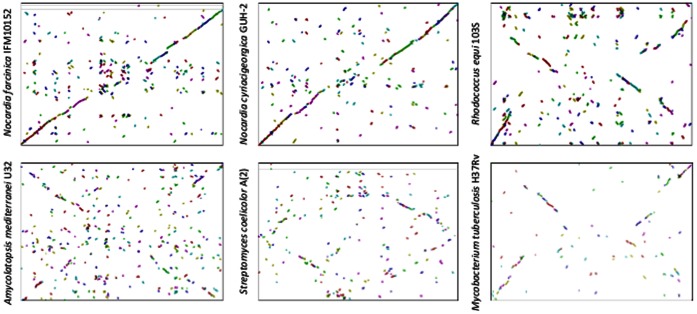
Figure 3. Syntenic dot plot of N. brasiliensis ATCC 700358 genome against Nocardia farcinica IFM10152 (a), Nocardia cyriacigeorgica GUH-2 (b), Rhodococcus equi 103S, Amycolatopsis mediterranei U32, Streptomyces coelicolor A(2), and Mycobacterium tuberculosis H37Rv genomes.
Dots represent a reciprocal best match by BLASTP comparison. The x-axis corresponds to the N. brasiliensis genome plotted against the rest of the genomes (y-axis). Inclination to the right corresponds to ORFs in same direction. An inclination to the left corresponds to an opposite direction. The highest homology in the Nocardia species was found at about the dnaA site. In each case, genome coverage was 30, 30, 11, 7, 5 and 4%.

