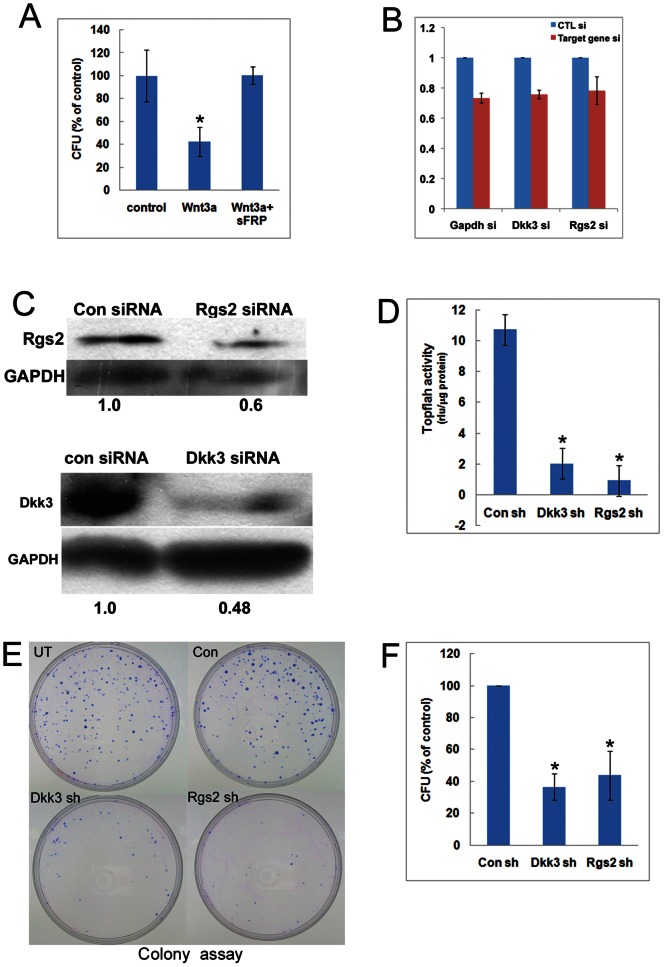
Figure 8. Exogenous Wnt treatment compromises a G0-induced program that promotes clonogenic potential.
(A) Wnt3A treatment of MB reduces clonogenic potential. Colony formation was measured after 48 hrs in control culture conditions (either in proliferating conditions-Mb, or in suspension culture-G0), or in the presence of 50 ng/ml of rWnt3A. Cloning efficiency (a measure of self-renewal) was strongly reduced by Wnt3A supplementation and restored by simultaneous addition of 50ng/ml sFRP2. Values represent the mean±SEM from three independent experiments, p<0.05 (denoted by asterisk *). (B) Knockdown of Rgs2 and Dkk3 transcripts using siRNAs. siRNAs were designed against the putative Wnt regulators Rgs2, Dkk3 or an irrelevant gene (GAPDH) or a control scrambled siRNA sequence and transfected into C2C12 myoblasts along with a GFP plasmid. GFP+ transfected cells were enriched by FACS, RNA isolated and analysed by Q-RT-PCR and the relative mRNA levels calculated. In each pair, the mRNA level is depicted of cells transfected with scrambled siRNA (blue bars) and cells transfected with the targeting siRNA (pink bars). Values represent the mean and SEM of 3 independent experiments. In each case, modest but reproducible reduction of the target transcript level is observed. (C) Reduction of Rgs2 and Dkk3 protein expression by siRNA-mediated knockdown. Western blot analysis of total protein isolated from control and knockdown C2C12 muscle cells probed with antibodies against Rgs2 (top) and Dkk3 (bottom). GAPDH protein levels indicate equal loading. Data depicted is representative of 3 independent experiments. (D) Rgs2 and Dkk3 expression is necessary for Wnt signaling. Knockdown of either Rgs2 or Dkk3 in growing or quiescent MB leads to suppression of TOPflash activity. Cells were treated and enriched as described in (B) and luciferase activity measured. Despite modest reduction of protein levels, strong reduction in TOPflash activity are seen, indicating a critical role for Rgs2 and Dkk3 in Wnt-βcat signaling. Values represent the mean and SEM of 3 independent experiments. (E,F) Knockdown cells (‘Rgs sh’ and ‘Dkk sh’) were enriched as described in (B) cultured in quiescence-inducing conditions, recovered from suspension culture and plated at clonogenic density for assessment of self-renewal (colony formation). Controls include untransfected cells (‘UT’) and control shRNA transfected cells (‘Con sh’). Typical plates with colony assays are shown in (E) and data are quantified as CFU (colony forming units) in (F). Values represent the mean and SEM of 3 independent experiments.

