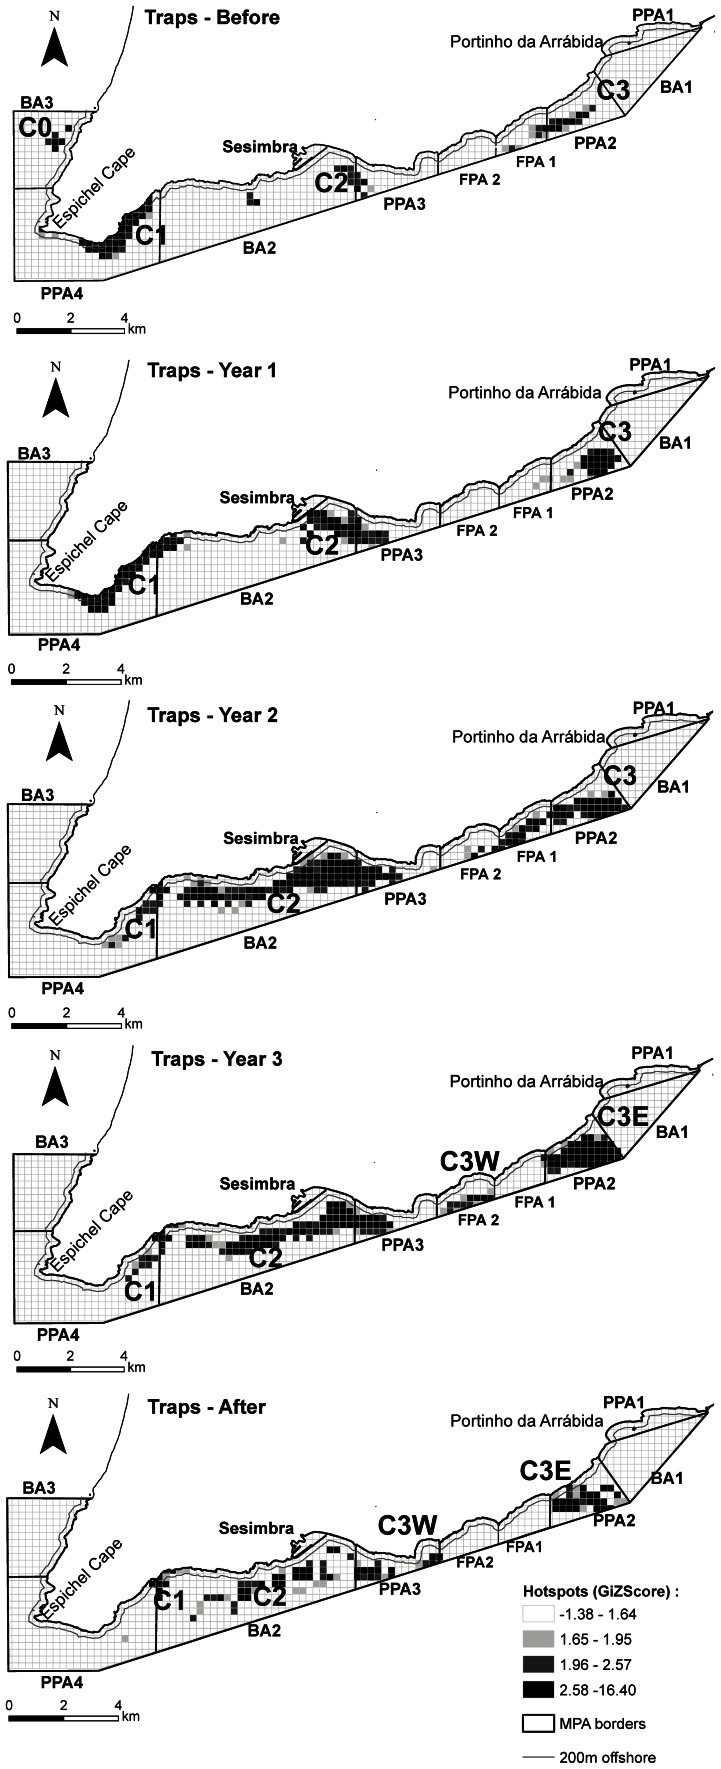
Figure 5. Maps obtained from the hotspot analyses of trap buoys for each period.
The location of significant clusters (GIZScore >1.96) by period (a – Before, b – Year 1, c – Year 2, d – Year 3, e – After), and the different protection levels at the Arrábida Marine Park are shown: BA – buffer area; PPA – partial protection area; FPA – fully protected area (see Methods for a detailed description of the protection levels in the park and their implementation through time). The 200 m offshore line is also shown.

