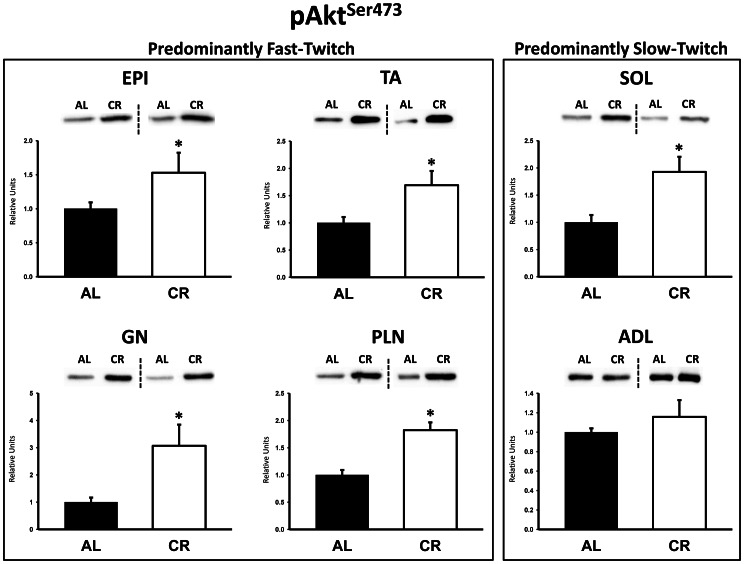
Figure 4. Akt Ser473 phosphorylation (pAktSer473) in predominantly fast-twitch and predominantly slow-twitch muscles.
EPI, epitrochlearis; GN, gastrocnemius; TA, tibialis anterior; PLN, plantaris; SOL, soleus; ADL, adductor longus. Filled bars are the AL group and open bars are the CR group. Values are normalized to the average value of the AL samples on each blot. *P<0.05, CR versus AL. Data are means ± SE. n = 6–8 rats per treatment group.

