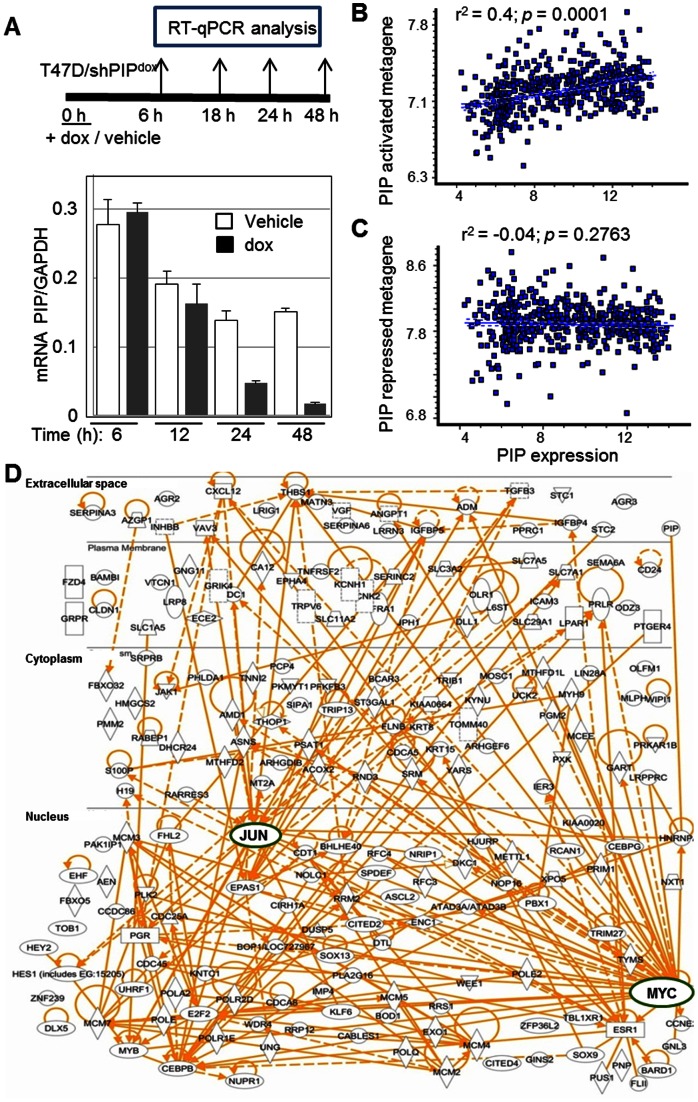
Figure 2. Identification of PIP-regulated genes in breast cancer.
A, T47D/shPIPdox cells were treated with dox (250 ng/ml) or vehicle, and RNA was extracted at four time points as schematically illustrated in the upper panel. RT-qPCR analysis of PIP with GAPDH as control (bottom panel) demonstrates effective PIP knockdown at the 24 and 48, but not at the 6 or 12-hour time points. B–C, Analysis of the clinical correlations in a cohort of 557 BCa tumors between PIP mRNA and either the PIP-activated (B) or the PIP-repressed metagenes (C), defined as the average normalized expression of genes that were either repressed (B) or stimulated (C) by ≥2-fold in the T47D/shPIPdox cell culture model. D, 293 genes down-regulated by ≥1.5-fold one day after PIP knockdown were subjected to the pathway analysis tool from Ingenuity Systems (IPA™). Connections are shown among 200 genes for which matched entries were found. Each connection indicates at least one direct relationship found in the literature. Circles denote the highly connected cMYC and cJUN nodes.

