
Fig. 1. Physiologic parameters in response to LPS tolerance.
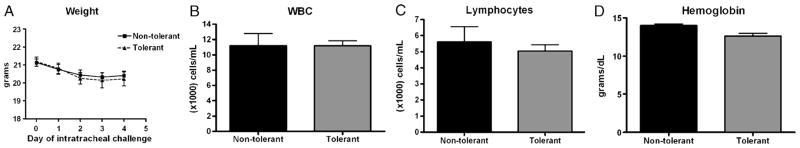
A, Mouse weights were measured the day before, and each day, mice received intratracheal challenges. Complete differential was performed on blood collected from the tail vein and total white blood cell counts (B), lymphocyte counts (C), and hemoglobin concentrations (D) are represented. Data are expressed as mean ± SEM (n = 6–12 mice per group). There were no differences between the tolerant and nontolerant animals in any of the measured parameters.