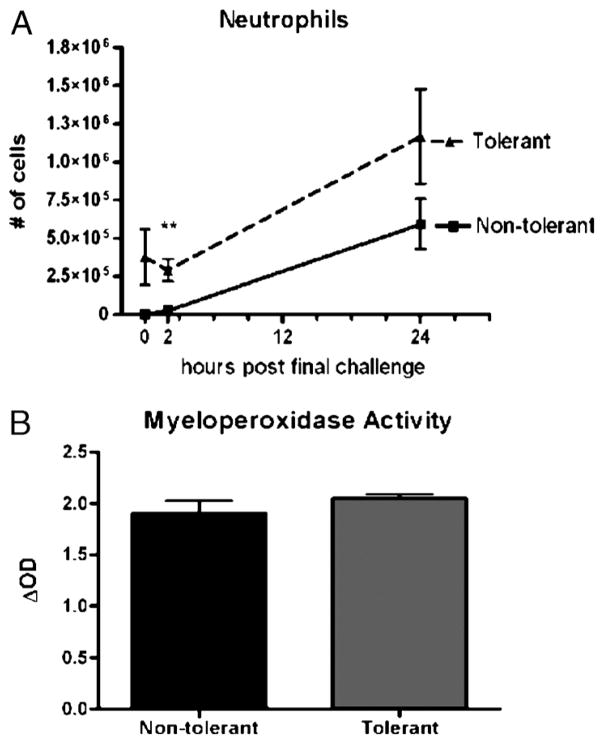
Fig. 7. Neutrophil influx and MPO activity in response to LPS tolerance.
A, Bronchoalveolar lavage neutrophil numbers at various time points post–final challenge. Cytospins were prepared and quantified for collected cells, and data are represented as absolute cell number per mouse. B, After BAL, the right lung was homogenized and sonicated for MPO assay. Data are expressed as mean ± SEM (n = 6–10 mice per group). **P < 0.01 compared with the nontolerant group.

