Fig. 2.

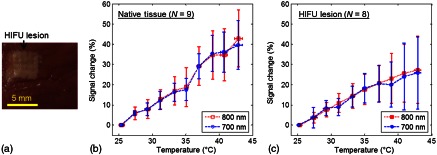
(a) Gross photo of a tissue specimen with an HIFU lesion generated before PA experiment. (b) and (c) The relative signal change (%) of the averaged normalized PA amplitude as a function of temperature in native tissues and in HIFU lesions. .

(a) Gross photo of a tissue specimen with an HIFU lesion generated before PA experiment. (b) and (c) The relative signal change (%) of the averaged normalized PA amplitude as a function of temperature in native tissues and in HIFU lesions. .