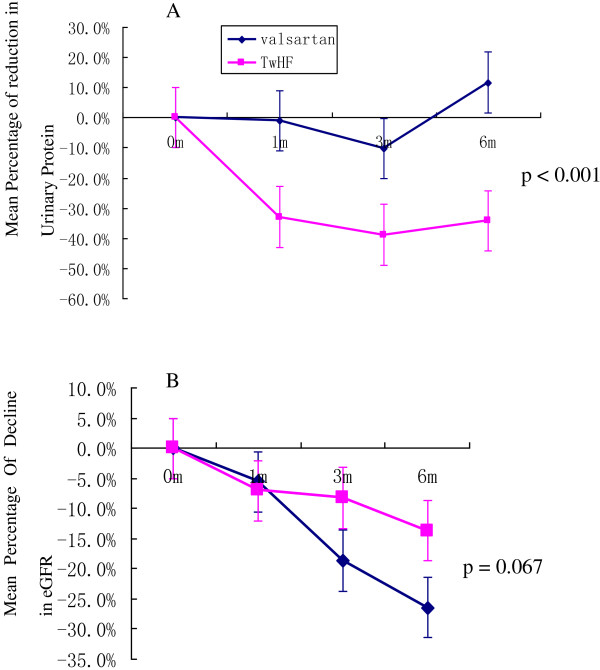
Figure 2.
Changes in the baseline 24-h urine protein and eGFR levels over the six months of TwHF and valsartan treatments. A: The reductions in the urine protein levels of the available patients, expressed as the mean percentages of urine protein reduction compared with the baseline levels; B: The mean reductions in the eGFR values of the available patients, expressed as the mean percentages of eGFR reduction compared with the baseline. Each error bar represents the standard deviation from the mean value. The statistical analysis was performed using repeated-measures ANOVA. (TwHF group vs. valsartan group).

