Fig. 2.

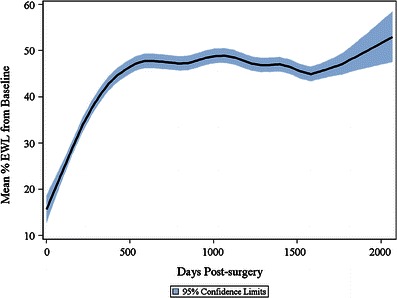
Mean percentage EWL from pre-surgery baseline. Graph shows the mean ±95 % confidence intervals (shaded) for the overall study population

Mean percentage EWL from pre-surgery baseline. Graph shows the mean ±95 % confidence intervals (shaded) for the overall study population