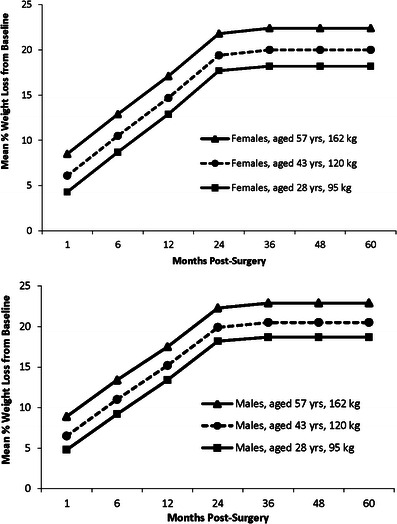
Fig. 3.

Mean percentage weight loss from pre-surgery baseline showing the effects of age, baseline weight, and sex. Baseline ages of 28, 43, and 57 years and weights of 95, 120, and 162 kg are the 10, 50, and 90 quintiles, respectively, of the whole study population. Graphs show the mean % weight loss for females and males in the 50 % age and baseline weight quintiles (43 years, 120 kg) and the two groups showing the largest differences in percentage weight loss at all time points
