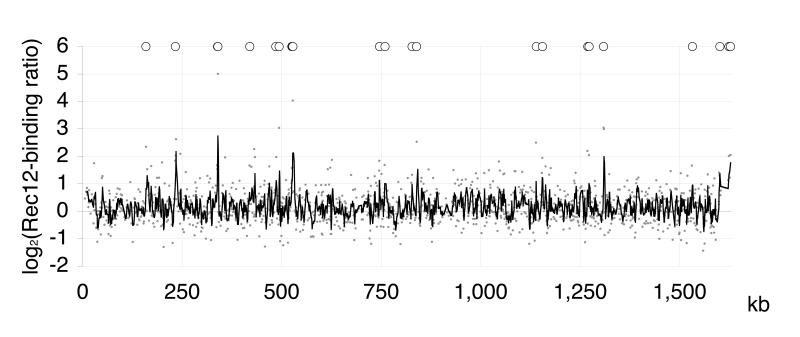
Fig. 2.
Mapping of Rec12-binding on the left arm of chromosome II
On the x-axis, the left telomere is given at 0 kb, the centromere at 1.600 kb. Microarray signal ratios of Rec12 enrichment relative to input were plotted for each probe against chromosome position and are given in a log2 scale as the mean of 2 (ORF sequences) or 4 (intergenic sequences) independent experiments (small gray dots). The black line indicates a moving average curve over 3 values (~3.3 kb). The Rec12-binding peaks determined by the CHIPOTIe algorithm are indicated above the curve (O).

