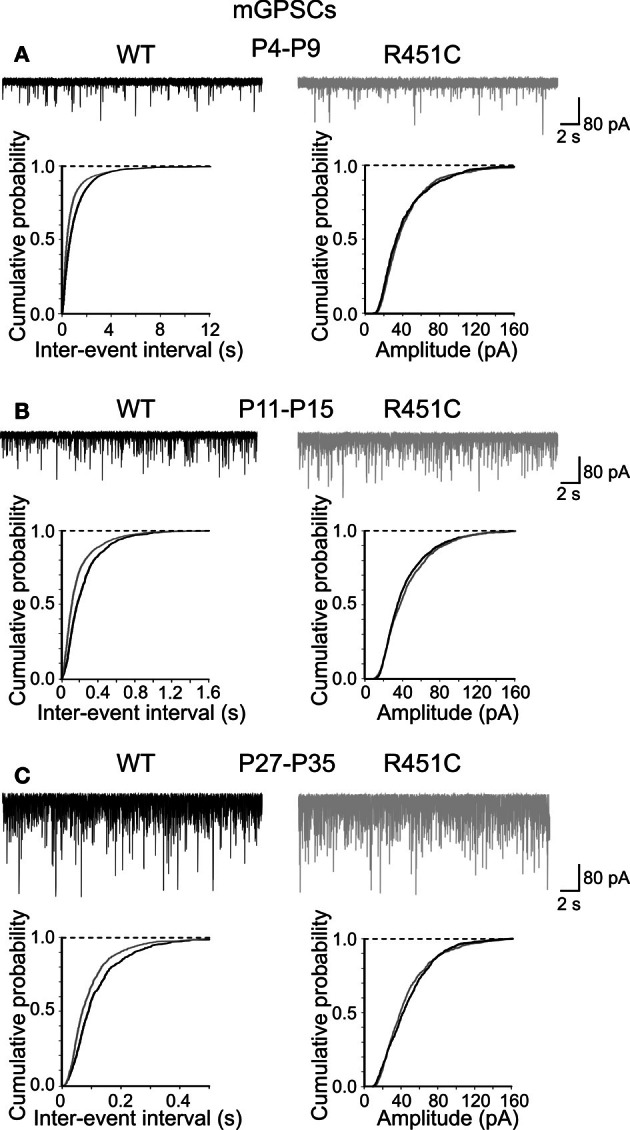
Figure 2.

The NL3R451C knock-in mutation enhances the frequency of mGPSCs. Samples traces of mGPSCs recorded from CA3 principal cells at P4–P9 (A), P11–P15 (B) and P27–P35 (C) from WT (black) and in NL3R451C knock-in mice (gray). Below, cumulative probability plots of inter-event intervals (left) and amplitude (right) of obtained from WT and NL3R451C knock-in mice. Changes in inter-event-interval (p < 0.05; K–S test) but not in amplitude (p > 0.05; K–S test) were significantly different at all developmental stages examined.
