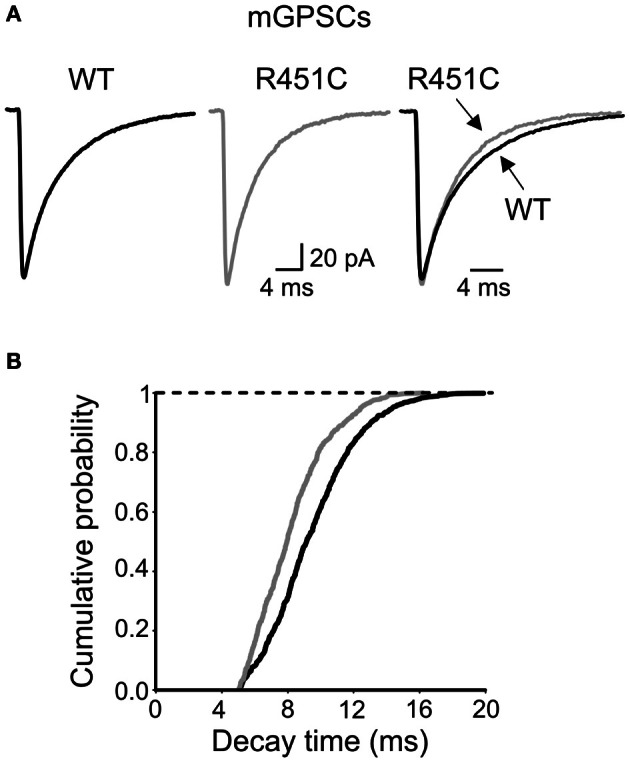
Figure 6.

Faster decay of mGPSCs in NL3R451C knock-inmice. (A) Sample traces of mGPSCs (each trace is the average of >50 individual traces) obtained from NL3R451C knock-inmice (gray) and control littermates (WT, black). On the right the two traces are superposed. (B) Cumulative probability plot of decay times from WT (black; n = 9) and NL3R451C knock-inmice (gray; n = 8). The two curves are significantly different (p < 0.01; K–S test).
