
Figure 3.
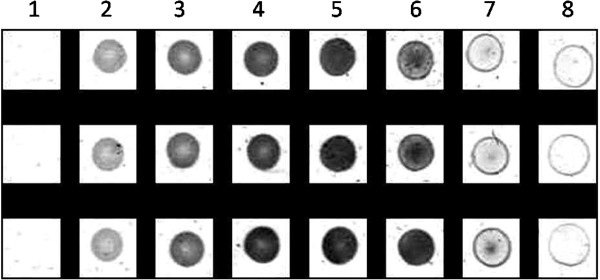
Cropped, aligned and color-inverted picture of hydrolysis spots by P. cepacia lipase from low (2) to high concentration (8). Each column shows triplicates. Column (1) shows control without enzyme.
Official websites use .gov
A
.gov website belongs to an official
government organization in the United States.
Secure .gov websites use HTTPS
A lock (
) or https:// means you've safely
connected to the .gov website. Share sensitive
information only on official, secure websites.
Cropped, aligned and color-inverted picture of hydrolysis spots by P. cepacia lipase from low (2) to high concentration (8). Each column shows triplicates. Column (1) shows control without enzyme.