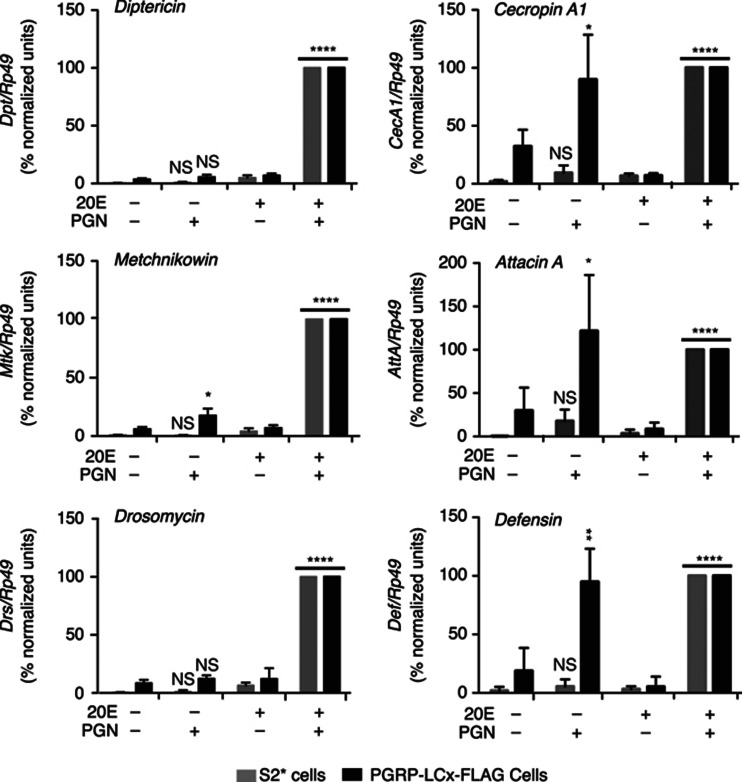
Figure 3.
20E-dependent and -independent expression of AMP genes in PGRP-LCx-FLAG cells. qRT–PCR analysis of Dpt, Mtk, Drs, CecA1, AttA and Def expression from parental S2* (grey bars) and PGRP-LCx-FLAG cells (black bars). Cells, with or without 24 h of 20E pretreatment, were stimulated with PGN for 6 h (or not), and then harvested for RNA isolation, as indicated. AMP gene expression was normalized to Rp49 levels, and then normalized between biological replicates and represented as a percentage of the expression level relative to the 20E treated and PGN-stimulated samples from each cell type. For each treatment, the values shown represent the mean of three independent experiments. Error bars represent standard deviations and *P<0.05, **P<0.01, ****P<0.0001 were calculated using unpaired t-test for comparing the corresponding samples with or without hormonal treatment.

