Figure 5.
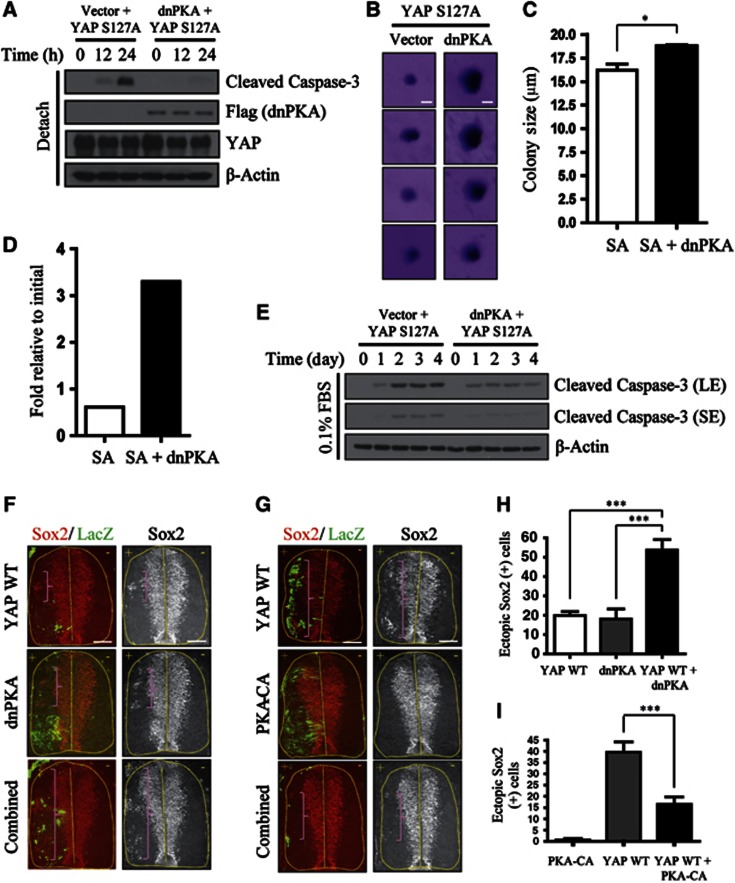
Functional cooperation between PKA and YAP. (A) YAP S127A and dnPKA cooperate to resist anoikis. NIH3T3 cells expressing Flag–YAP S127A alone or Flag–YAP S127A plus Flag–dnPKA were seeded onto poly-HEMA-coated dishes and incubated for the indicated times. The apoptosis index was measured by immunoblotting for cleaved caspase-3. (B) Cells from (A) were also grown in soft agar for 15 days. Colonies were stained with crystal violet and imaged with a dissecting microscope. Scale bar, 10 μm. (C) Quantification of average colony size for the results in (B). The result was quantified from three independent experiments with triplicates in each experiment. Error bar indicates s.e.m. (two-tailed Student’s t-test). *P<0.05. (D) YAP S127A and dnPKA cooperate to resist serum starvation-induced cell death. Approximately 5 × 10³ cells from (A) were seeded onto 6-well plates. One day later, media were changed to DMEM containing 0.1% FBS and cells were maintained for 6 days. Cell numbers were counted and expressed as fold induction relative to the original number of cells (5 × 10³). The graph shown is a representative result from two independent experiments. (E) Cells incubated in 0.1% FBS for the indicated number of days were analysed by immunoblotting for caspase-3 cleavage. SE, short exposure; LE, long exposure. (F) YAP WT and dnPKA cooperate to generate ectopic neural progenitors in developing chick. Immunohistochemical analyses of ectopic neural progenitor formation in chick spinal cords electroporated with YAP WT, dnPKA, or YAP WT plus dnPKA, along with LacZ (left) to mark the transfected side. Neural progenitors were detected by immunostaining for Sox2. Brackets indicate ectopic Sox2+ neural progenitor cells. +, electroporated side. Scale bar, 75 μm. (G) PKA-CA suppresses YAP-induced generation of ectopic neural progenitors. Similar procedure as in (F) using YAP WT, PKA-CA, and YAP WT plus PKA-CA. Scale bar, 75 μm. (H) The number of ectopic neural progenitors from (F) were quantified. ***P<0.001. (I) Quantification of results in (G). ***P<0.001. Error bars indicate s.e.m.’s (two-tailed Student’s t-test).

