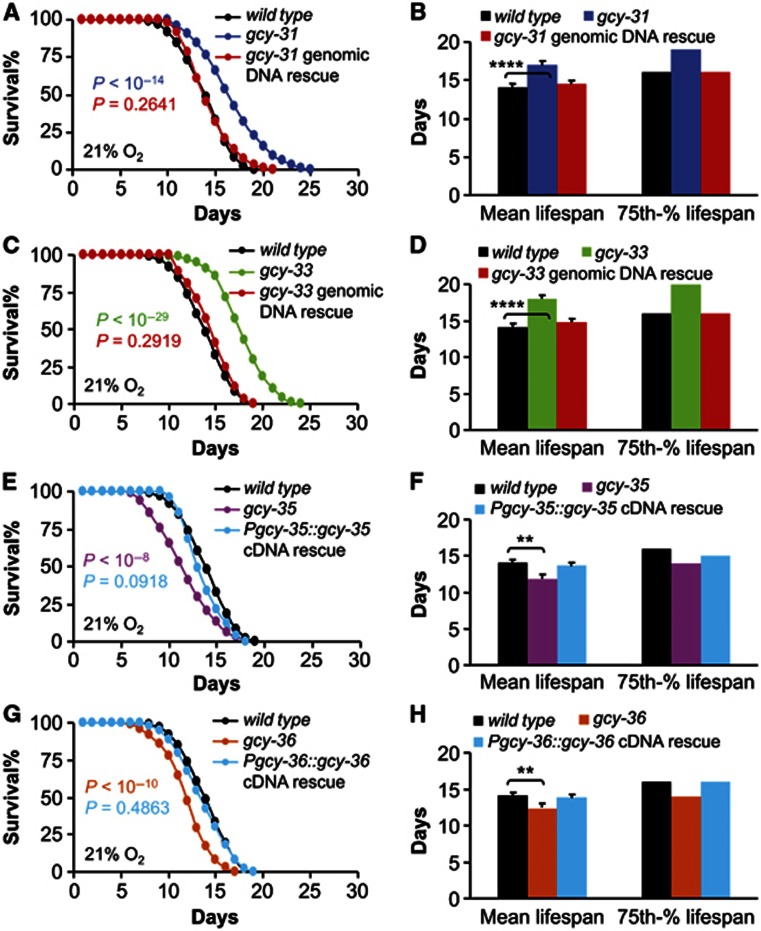
Figure 2.
Lifespan phenotypes of gcy-31, gcy-33, gcy-35, and gcy-36 mutants. Survival curves (A, C, E and G) and mean lifespan and 75th percentile lifespan (B, D, F and H) of gcy-31(ok296) mutants and gcy-31(ok296) mutants expressing wildtype gcy-31 genomic DNA (n=93–113 per genotype) (A, B), gcy-33(ok232) mutants and gcy-33(ok232) mutants expressing wildtype gcy-33 genomic DNA (n=37–138 per genotype) (C, D), gcy-35(ok769) mutants and gcy-35(ok769) mutants expressing gcy-35 cDNA from its endogenous promoter (n=96–140 per genotype) (E, F), or gcy-36(db66) mutants and gcy-36(db66) mutants expressing gcy-36 cDNA from its endogenous promoter (n=116–142 per genotype) (G, H) versus shared wildtype controls (n=154). (A, C, E and G) show animals pooled from multiple independent experiments, and the same pool of wildtype controls was used in these curves. (B, D, F and H) show analysis from a representative single experiment (n=28–39 per group). **P<0.01, ****P<0.0001, statistics for curve comparisons are shown in the figure. Error bars represent mean±s.e.m.

