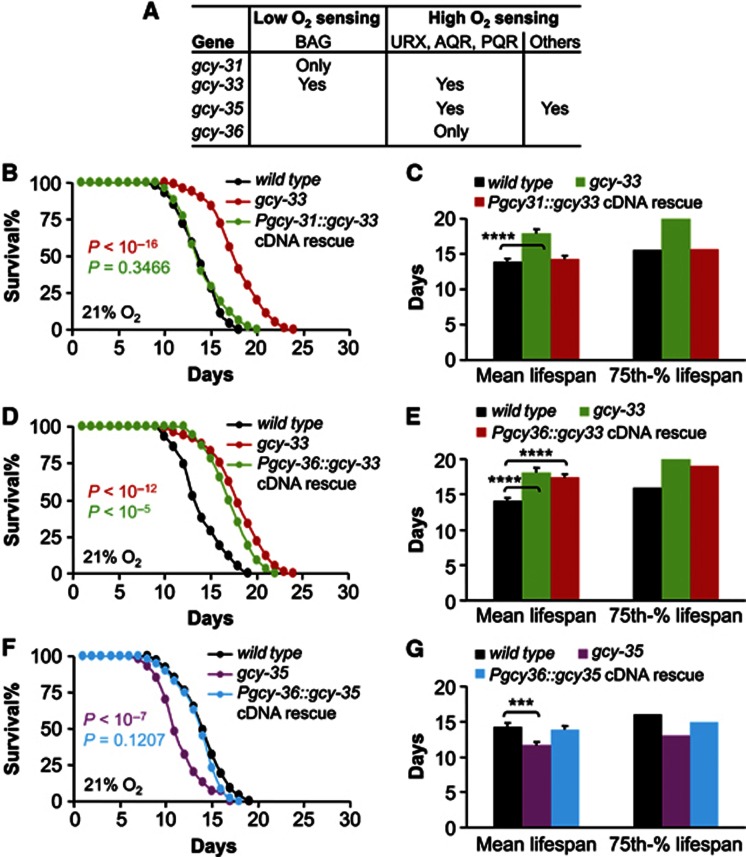
Figure 3.
Tissue-specific transgenic rescue of lifespan phenotypes of gcy-33 and gcy-35 mutants. (A) Expression profiles of individual gcy genes in O2-sensing neurons. (B–G) Survival curves (B, D and F) and mean lifespan and 75th percentile lifespan (C, E and G) of wildtype controls versus gcy-33(ok232) mutants and gcy-33(ok232) mutants expressing gcy-33 cDNA from gcy-31 promoter (n=52–80 per genotype) (B, C), of wildtype controls versus gcy-33(ok232) mutants (n=84) and gcy-33(ok232) mutants expressing gcy-33 cDNA from gcy-36 promoter (n=32–84 per genotype) (D, E), and of wildtype controls versus gcy-35(ok769) mutants and gcy-35(ok769) mutants expressing gcy-35 cDNA from gcy-36 promoter (n=60–74 per genotype) (F, G). (B, D and F) show animals pooled from multiple independent experiments; (C, E and G) show analysis from a representative single experiment (n=25–42 per group). ***P<0.001, ****P<0.0001, statistics for curve comparisons are shown in the figure. Error bars represent mean±s.e.m.

